 |

|
Page 1 of 1
|
[ 8 posts ] |
|
Need help with scatter spline chart axes
| Author |
Message |
|
mikerobinson
pChart user
Joined: Fri Jan 28, 2011 10:33 pm
Posts: 5
|
 Need help with scatter spline chart axes I adapted the example scatter spline chart to something I'm doing and there are two things I would like to do that I don't know how to: 1) Set the axes to go from 0-35 for the y-axis and 0 - 12 for the x-axis. The y-axis doesn't need a maximum value, but I definitely want it to have a minimum value. 2) Set the x-axis to have the names of each month 3) Have the month names in between the ticks on the x-axis instead of right underneath them. So for example between the ticks for 0 and 1 would be "Jan", between 1 and 2 would be "Feb", etc. Any help would be greatly appreciated. Here is my code: Code: /* Create the pData object */
$myData = new pData();
foreach ($totals as $year => $arr) {
foreach ($arr as $num) {
$myData->addPoints($num,$year);
}
}
$myData->setAxisName(0,"Sales USD (billions)");
$myData->setAxisXY(0,AXIS_Y);
$myData->setAxisPosition(0,AXIS_POSITION_LEFT);
/* Create the Y axis and the binded series */
foreach ($x_values as $value) {
$myData->addPoints($value,"Probe 3");
}
$myData->setSerieOnAxis("Probe 3",1);
$myData->setAxisXY(1,AXIS_X);
$myData->setAxisPosition(1,AXIS_POSITION_BOTTOM);
$n = 0;
foreach ($totals as $year => $arr) {
$myData->setScatterSerie("Probe 3",$year,$n);
$myData->setScatterSerieDescription($n,$year);
$n++;
}
$months = array('Jan','Feb','Mar','Apr','May','Jun','Jul','Aug','Sep','Oct','Nov','Dec');
$myData->addPoints($months,"Labels");
$myData->setSerieDescription("Labels","Months");
$myData->setAbscissa("Labels");
/* Create the pChart object */
$myPicture = new pImage(400,400,$myData);
/* Draw the background */
$Settings = array("R"=>170, "G"=>183, "B"=>87, "Dash"=>1, "DashR"=>190, "DashG"=>203, "DashB"=>107);
$myPicture->drawFilledRectangle(0,0,400,400,$Settings);
/* Overlay with a gradient */
$Settings = array("StartR"=>219, "StartG"=>231, "StartB"=>139, "EndR"=>1, "EndG"=>138, "EndB"=>68, "Alpha"=>50);
$myPicture->drawGradientArea(0,0,400,400,DIRECTION_VERTICAL,$Settings);
$myPicture->drawGradientArea(0,0,400,20,DIRECTION_VERTICAL,array("StartR"=>0,"StartG"=>0,"StartB"=>0,"EndR"=>50,"EndG"=>50,"EndB"=>50,"Alpha"=>80));
/* Write the picture title */
$myPicture->setFontProperties(array("FontName"=>"pChart/Silkscreen.ttf","FontSize"=>6));
$myPicture->drawText(10,13,"drawScatterSplineChart() - Draw a scatter spline chart",array("R"=>255,"G"=>255,"B"=>255));
/* Add a border to the picture */
$myPicture->drawRectangle(0,0,399,399,array("R"=>0,"G"=>0,"B"=>0));
/* Set the default font */
$myPicture->setFontProperties(array("FontName"=>"pChart/pf_arma_five.ttf","FontSize"=>6));
/* Set the graph area */
$myPicture->setGraphArea(50,50,350,350);
/* Create the Scatter chart object */
$myScatter = new pScatter($myPicture,$myData);
/* Draw the scale */
$myScatter->drawScatterScale();
/* Turn on shadow computing */
$myPicture->setShadow(TRUE,array("X"=>2,"Y"=>2,"R"=>0,"G"=>0,"B"=>0,"Alpha"=>20));
/* Draw a scatter plot chart */
$myScatter->drawScatterSplineChart();
// $myScatter->drawScatterPlotChart(); // adds the little bubbles
/* Draw the legend */
$myScatter->drawScatterLegend(280,380,array("Mode"=>LEGEND_HORIZONTAL,"Style"=>LEGEND_NOBORDER));
/* Render the picture (choose the best way) */
$myPicture->autoOutput("stats_images/stats2.png");
Attachments:
File comment: This is what I have now:
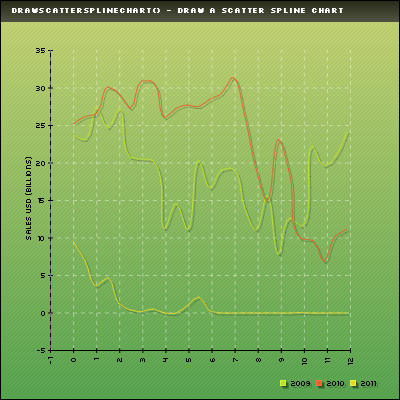 stats2.png [ 42.4 KiB | Viewed 10728 times ]
|
| Thu Feb 03, 2011 1:59 am |

|
|
|
mikerobinson
pChart user
Joined: Fri Jan 28, 2011 10:33 pm
Posts: 5
|
Re: Need help with scatter spline chart axes Update, I figured out how to set the axis boundaries. I just need to know how to do #2 and #3
|
| Thu Feb 03, 2011 2:32 am |
|
|
|
mice32
Experienced pChart user
Joined: Thu Dec 02, 2010 3:03 pm
Posts: 36
Location: Somerville, MA, USA
|
Re: Need help with scatter spline chart axes I think, you don't need to use pScatter, try more simple way: http://wiki.pchart.net/doc.chart.drawsplinechart.html
_________________

|
| Thu Feb 03, 2011 3:44 am |

|
|
|
jean-damien
Site Admin
Joined: Thu Dec 02, 2010 2:31 pm
Posts: 409
Location: France
|
Re: Need help with scatter spline chart axes Scatter Charts only support numeric scales so it isn't possible to use it to write string values. I believe that I'll add the possibility to call a user defined function when labeling the axis so you can override this (assuming you got an integer stepped axis) Using the scatter drawing methods, the following code is useless as it is not defined in any scatter serie (setScatterSerie) : Code: $months = array('Jan','Feb','Mar','Apr','May','Jun','Jul','Aug','Sep','Oct','Nov','Dec');
$myData->addPoints($months,"Labels");
$myData->setSerieDescription("Labels","Months");
$myData->setAbscissa("Labels");
As said by mice32, the standard drawSpline function will better fit your needs. JD.
|
| Thu Feb 03, 2011 8:37 am |
|
|
|
mikerobinson
pChart user
Joined: Fri Jan 28, 2011 10:33 pm
Posts: 5
|
Re: Need help with scatter spline chart axes Thanks for getting back to me. I have another one that I did with a regular spline chart, however I don't know how to make it so that there can be data that is in between values for both the x and y axis. Is this possible?
|
| Thu Feb 03, 2011 10:34 pm |
|
|
|
mikerobinson
pChart user
Joined: Fri Jan 28, 2011 10:33 pm
Posts: 5
|
Re: Need help with scatter spline chart axes bump
|
| Mon Feb 07, 2011 9:18 pm |
|
|
|
jean-damien
Site Admin
Joined: Thu Dec 02, 2010 2:31 pm
Posts: 409
Location: France
|
Re: Need help with scatter spline chart axes Hi Mike, Are you speaking of this point : Quote: Have the month names in between the ticks on the x-axis instead of right underneath them. So for example between the ticks for 0 and 1 would be "Jan", between 1 and 2 would be "Feb", etc. If it is the case, this isn't something possible today, I may add this option but I'm not sure that it would be something easy to read/interpret on a chart. JD.
|
| Tue Feb 08, 2011 11:38 am |
|
|
|
mikerobinson
pChart user
Joined: Fri Jan 28, 2011 10:33 pm
Posts: 5
|
Re: Need help with scatter spline chart axes That would be nice, but not what I was talking about there. What I mean is having both axes increment their values by integers, so the ticks would go 0, 1, 2, etc, however put a value between the ticks, like for example, 0.459 on the x-axis and 3.1254 on the y-axis. From what I have seen, every value on the x-axis will have a tick under it. This doesn't work for me because I have 3 or 4 points in each month (as you can see from the original chart), which is why I thought it was necessary to use a scatter chart.
|
| Tue Feb 08, 2011 5:38 pm |
|
|
|
|
Page 1 of 1
|
[ 8 posts ] |
|
Who is online |
Users browsing this forum: No registered users and 13 guests |
|
You cannot post new topics in this forum
You cannot reply to topics in this forum
You cannot edit your posts in this forum
You cannot delete your posts in this forum
You cannot post attachments in this forum
|

|
|
