 |
 |
 |

|
Page 1 of 1
|
[ 1 post ] |
|
| Author |
Message |
|
Kirill
New pChart user
Joined: Sun Nov 20, 2011 2:26 pm
Posts: 1
|
 less values on Y axis? Hi. I need a chart to have less values on the Y axis. Is there a way I can specify how many intervals I need?
The chart is a bar chart and it has 5 values on the X axis, with the first one being really small (100-1000) and the last one being big (50 000 - ....)
Right now, the chart is being drawn with a lot of intervals (0 to 2 100 000), I'd like it to have about 7-10
is it possible?
Attachments:
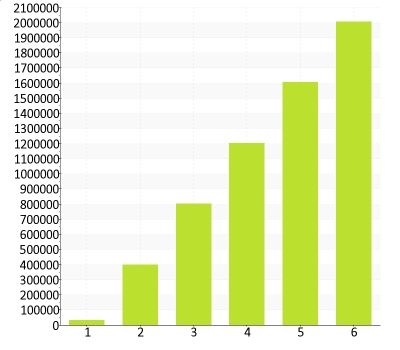 bar.jpg [ 47.29 KiB | Viewed 3985 times ]
|
| Sun Nov 20, 2011 3:19 pm |

|
|
|
|
Page 1 of 1
|
[ 1 post ] |
|
Who is online |
Users browsing this forum: No registered users and 37 guests |
|
You cannot post new topics in this forum
You cannot reply to topics in this forum
You cannot edit your posts in this forum
You cannot delete your posts in this forum
You cannot post attachments in this forum
|

|
|
|