 |

|
Page 1 of 1
|
[ 2 posts ] |
|
Total values in stackedBarChart?
| Author |
Message |
|
jngeist
pChart user
Joined: Sat Apr 02, 2011 7:23 am
Posts: 6
|
 Total values in stackedBarChart? Hello, I'm new to pChart (as evidenced by the conspicuous similarity between my chart and the example script), and I'm having a bit of trouble. What I'm hoping to be able to do is display the total of the two elements above each bar. (That is, on the chart below, above the bar for 2008-09, a label would appear with the total, 4673.) Is there a way to do this that I'm just not seeing? (For clarification, this chart tracks student usage of a service I coordinate; the intention of the chart is to quickly indicate both the semester usage and the annual totals. A stacked bar chart seems to me to be the simplest way to do this, but I can find no way to incorporate the totals.) Thanks in advance for any advice. -J The code that generates the chart: Code: <?php
//$totals is a multidimensional array fed from a database.
$totalData = new pData();
$totalData->addPoints($totals['F'], 'Fall');
$totalData->addPoints($totals['S'], 'Spring');
$totalData->setAxisName(0, 'Student Usage Hours');
$totalData->addPoints(array_keys($totals['F']), 'AY');
$totalData->setSerieDescription('AY', "Academic Year");
$totalData->setAbscissa('AY');
$totalData->setPalette('Spring', array('R'=>102, 'G'=>204, 'B'=>51));
$totalData->setPalette('Fall', array('R'=>51, 'G'=>135, 'B'=>204));
$myPicture = new pImage(700, 230, $totalData);
$Settings = array("R"=>170, "G"=>183, "B"=>87, "Dash"=>1, "DashR"=>190, "DashG"=>203, "DashB"=>107);
$myPicture->drawFilledRectangle(0,0,700,230,$Settings);
$Settings = array("StartR"=>219, "StartG"=>231, "StartB"=>139, "EndR"=>1, "EndG"=>138, "EndB"=>68, "Alpha"=>50);
$myPicture->drawGradientArea(0,0,700,230,DIRECTION_VERTICAL,$Settings);
$myPicture->setFontProperties(array("FontName"=>"fonts/Junction 02.ttf","FontSize"=>11));
$myPicture->setGraphArea(60,30,650,190);
$myPicture->drawScale(array("CycleBackground"=>TRUE,"DrawSubTicks"=>TRUE,"GridR"=>0,"GridG"=>0,"GridB"=>0,"GridAlpha"=>10, "Mode"=>SCALE_MODE_ADDALL_START0));
$myPicture->setShadow(TRUE,array("X"=>1,"Y"=>1,"R"=>0,"G"=>0,"B"=>0,"Alpha"=>10));
$myPicture->setShadow(FALSE);
$myPicture->drawStackedBarChart(array("Rounded"=>TRUE,"DisplayValues"=>TRUE,"DisplayColor"=>DISPLAY_AUTO,"DisplaySize"=>10,"BorderR"=>255, "BorderG"=>255,"BorderB"=>255));
$myPicture->drawLegend(570,212,array("Style"=>LEGEND_NOBORDER,"Mode"=>LEGEND_HORIZONTAL));
$myPicture->Render('annualTotals.png');
?>
Attachments:
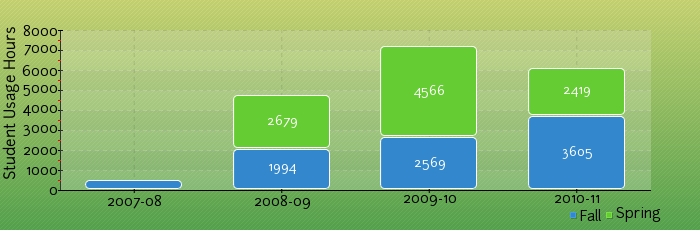 annualTotals.png [ 27.37 KiB | Viewed 4848 times ]
|
| Sat Apr 02, 2011 7:36 am |

|
|
|
jngeist
pChart user
Joined: Sat Apr 02, 2011 7:23 am
Posts: 6
|
Re: Total values in stackedBarChart? Update, in case any others face this problem: I didn't find a particularly simple solution, but I did find a solution. I added a third series, which contained the total values for each column, set it to Drawable=FALSE, and then drew the stacked bar. Then, I switched so that the two series in the stacked bar were not drawable, and the third, with the totals, was. I set the palette on that last series to Alpha=>0, and then drew a regular bar chart with DisplayValues=TRUE and DisplayColor=0,0,0. The result is a bar chart with invisible bars and properly positioned labels drawn in black, overlaid atop the stacked bar. Code and results below. If there's an easier way, I'd still love to hear it. Code: $totalData = new pData();
$totalData->addPoints($totals['F'], 'Fall');
$totalData->addPoints($totals['S'], 'Spring');
$totalData->addPoints($totals['T'], 'Total');
$totalData->setSerieDrawable('Total', FALSE);
$totalData->setAxisName(0, 'Student Usage Hours');
$totalData->addPoints(array_keys($totals['F']), 'AY');
$totalData->setSerieDescription('AY', "Academic Year");
$totalData->setAbscissa('AY');
$totalData->setPalette('Spring', array('R'=>102, 'G'=>204, 'B'=>51));
$totalData->setPalette('Fall', array('R'=>51, 'G'=>135, 'B'=>204));
$totalData->setPalette('Total', array('Alpha' => 0));
$myPicture = new pImage(700, 230, $totalData);
$Settings = array("R"=>170, "G"=>183, "B"=>87, "Dash"=>1, "DashR"=>190, "DashG"=>203, "DashB"=>107);
$myPicture->drawFilledRectangle(0,0,700,230,$Settings);
$Settings = array("StartR"=>219, "StartG"=>231, "StartB"=>139, "EndR"=>1, "EndG"=>138, "EndB"=>68, "Alpha"=>50);
$myPicture->drawGradientArea(0,0,700,230,DIRECTION_VERTICAL,$Settings);
$myPicture->setFontProperties(array("FontName"=>"../fonts/Junction 02.ttf","FontSize"=>11));
$myPicture->setGraphArea(60,30,650,190);
$myPicture->drawScale(array("CycleBackground"=>TRUE,"DrawSubTicks"=>TRUE,"GridR"=>0,"GridG"=>0,"GridB"=>0,"GridAlpha"=>10, "Mode"=>SCALE_MODE_ADDALL_START0));
$myPicture->setShadow(TRUE,array("X"=>1,"Y"=>1,"R"=>0,"G"=>0,"B"=>0,"Alpha"=>10));
$myPicture->setShadow(FALSE);
$myPicture->drawStackedBarChart(array("Rounded"=>TRUE,"DisplayValues"=>TRUE,"DisplayColor"=>DISPLAY_AUTO,"DisplaySize"=>10,"BorderR"=>255, "BorderG"=>255,"BorderB"=>255));
$myPicture->drawLegend(570,212,array("Style"=>LEGEND_NOBORDER,"Mode"=>LEGEND_HORIZONTAL));
$totalData->setSerieDrawable('Total', TRUE);
$totalData->setSerieDrawable('Spring', FALSE);
$totalData->setSerieDrawable('Fall', FALSE);
$myPicture->drawBarChart(array("DisplayValues" => TRUE, "DisplayColor"=>array('R'=>0, 'G'=>0, 'B'=>0), "DisplaySize"=>10));
$myPicture->Stroke();
Attachments:
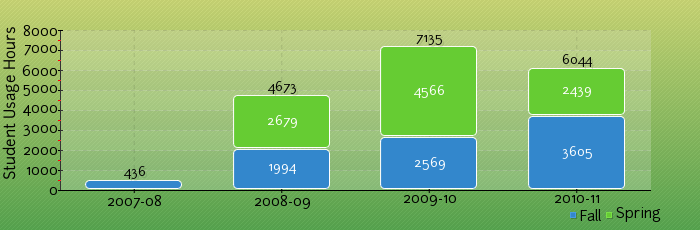 annualtotals_fixed.png [ 30.75 KiB | Viewed 4837 times ]
|
| Sun Apr 03, 2011 2:04 am |
|
|
|
|
Page 1 of 1
|
[ 2 posts ] |
|
Who is online |
Users browsing this forum: No registered users and 7 guests |
|
You cannot post new topics in this forum
You cannot reply to topics in this forum
You cannot edit your posts in this forum
You cannot delete your posts in this forum
You cannot post attachments in this forum
|

|
|