 |

|
Page 1 of 1
|
[ 8 posts ] |
|
2 series,one filled,one not filled,how??
| Author |
Message |
|
darko1984
pChart user
Joined: Fri Aug 26, 2011 9:44 am
Posts: 6
|
 2 series,one filled,one not filled,how?? Hi,the title explain all i want to know!
How can i plot 2 series on the sampe graph,one filled and the other not filled?
Thnak you for the help!
bye
|
| Fri Aug 26, 2011 9:47 am |

|
|
|
jean-damien
Site Admin
Joined: Thu Dec 02, 2010 2:31 pm
Posts: 409
Location: France
|
Re: 2 series,one filled,one not filled,how?? Hi, You have to use the setSerieDrawable() function to enable / disable series before drawing a kind of charts. Bellow an example : Code: /* pChart library inclusions */
include("../class/pData.class.php");
include("../class/pDraw.class.php");
include("../class/pImage.class.php");
/* Create and populate the pData object */
$MyData = new pData();
$MyData->addPoints(array(4,2,10,12,8,3),"Probe 1");
$MyData->addPoints(array(3,12,15,8,5,5),"Probe 2");
$MyData->setSerieTicks("Probe 2",4);
$MyData->setAxisName(0,"Temperatures");
$MyData->addPoints(array("Jan","Feb","Mar","Apr","May","Jun"),"Labels");
$MyData->setSerieDescription("Labels","Months");
$MyData->setAbscissa("Labels");
/* Create the pChart object */
$myPicture = new pImage(700,230,$MyData);
/* Turn of Antialiasing */
$myPicture->Antialias = FALSE;
/* Draw the background */
$Settings = array("R"=>170, "G"=>183, "B"=>87, "Dash"=>1, "DashR"=>190, "DashG"=>203, "DashB"=>107);
$myPicture->drawFilledRectangle(0,0,700,230,$Settings);
/* Overlay with a gradient */
$Settings = array("StartR"=>219, "StartG"=>231, "StartB"=>139, "EndR"=>1, "EndG"=>138, "EndB"=>68, "Alpha"=>50);
$myPicture->drawGradientArea(0,0,700,230,DIRECTION_VERTICAL,$Settings);
/* Add a border to the picture */
$myPicture->drawRectangle(0,0,699,229,array("R"=>0,"G"=>0,"B"=>0));
/* Write the chart title */
$myPicture->setFontProperties(array("FontName"=>"../fonts/Forgotte.ttf","FontSize"=>11));
$myPicture->drawText(150,35,"Average temperature",array("FontSize"=>20,"Align"=>TEXT_ALIGN_BOTTOMMIDDLE));
/* Set the default font */
$myPicture->setFontProperties(array("FontName"=>"../fonts/pf_arma_five.ttf","FontSize"=>6));
/* Define the chart area */
$myPicture->setGraphArea(60,40,650,200);
/* Draw the scale */
$scaleSettings = array("XMargin"=>10,"YMargin"=>10,"Floating"=>TRUE,"GridR"=>255,"GridG"=>255,"GridB"=>255,"DrawSubTicks"=>TRUE,"CycleBackground"=>TRUE);
$myPicture->drawScale($scaleSettings);
/* Write the chart legend */
$myPicture->drawLegend(540,20,array("Style"=>LEGEND_NOBORDER,"Mode"=>LEGEND_HORIZONTAL));
/* Turn on Antialiasing */
$myPicture->Antialias = TRUE;
/* Draw the area chart */
$MyData->setSerieDrawable("Probe 1",TRUE);
$MyData->setSerieDrawable("Probe 2",FALSE);
$myPicture->drawAreaChart();
/* Draw a line and a plot chart on top */
$MyData->setSerieDrawable("Probe 2",TRUE);
$myPicture->setShadow(TRUE,array("X"=>1,"Y"=>1,"R"=>0,"G"=>0,"B"=>0,"Alpha"=>10));
$myPicture->drawLineChart();
$myPicture->drawPlotChart(array("PlotBorder"=>TRUE,"PlotSize"=>3,"BorderSize"=>1,"Surrounding"=>-60,"BorderAlpha"=>80));
/* Render the picture (choose the best way) */
$myPicture->autoOutput("pictures/example.Combo.area.lines.png");
Kind regards, JD.
Attachments:
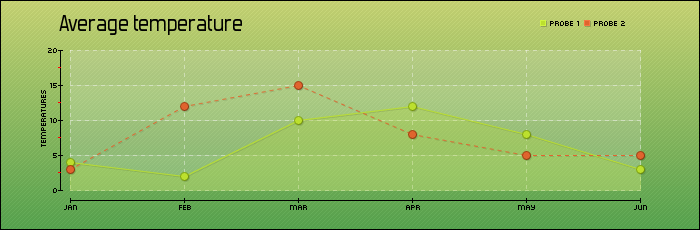 example_Combo_area_lines.png [ 22.87 KiB | Viewed 26740 times ]
|
| Fri Aug 26, 2011 9:59 am |

|
|
|
darko1984
pChart user
Joined: Fri Aug 26, 2011 9:44 am
Posts: 6
|
Re: 2 series,one filled,one not filled,how?? Thank you for the answer but i don't know how to apply this on my code Here is my code Code: <?php /* Include all the classes */
include("/var/www/pchart/class/pDraw.class.php");
include("/var/www/pchart/class/pImage.class.php");
include("/var/www/pchart/class/pData.class.php");
/* Create your dataset object */
$myData = new pData();
/* Connect to the MySQL database */
$db = mysql_connect("xxxxxx", "xx", "xx");
mysql_select_db("xxxx",$db);
/* Build the query that will returns the data to graph */
$Requete = "select * from (select * from archive order by dateTime DESC limit 73) as archive order by dateTime ASC";
$Result = mysql_query($Requete,$db);
while($row = mysql_fetch_array($Result))
{
/* Push the results of the query in an array */
$dateTime[] = $row["dateTime"];
$dewpoint[] = 0.56*($row["dewpoint"]-32);
$outHumidity[] = $row["outHumidity"];
}
/* Prepare some nice data & axis config */
$myData = new pData();
$myData->addPoints($dewpoint,"Dewpoint");
$myData->addPoints($outHumidity,"Umidita'");
$myData->setSerieOnAxis("Dewpoint",0);
$myData->setSerieOnAxis("Umidita'",1);
$myData->setAxisName(0,"");
$myData->setAxisUnit(0,"°C");
$myData->setAxisName(1,"");
$myData->setAxisUnit(1,"%");
$myData->setAxisPosition(1,AXIS_POSITION_RIGHT);
/*$myData->setPalette("Umidita'",array("R"=>0,"G"=>100,"B"=>255));*/
$myData->setSerieWeight("Dewpoint",2);
$myData->setSerieWeight("Umidita'",2);
/* Create the X serie */
$myData->addPoints($dateTime,"dateTime");
$myData->setAbscissa("dateTime");
$myData->setXAxisDisplay(AXIS_FORMAT_DATE,"H:i");
$myData->setAbscissaName("");
/* Will replace the whole color scheme by the "light" palette */
$myData->loadPalette("/var/www/pchart/palettes/?.color", TRUE);
/* DIMENSIONI TOTALI IMMAGINE */
$myData = new pImage(700,241,$myData);
/* Choose a nice font */
$myData->setFontProperties(array("FontName"=>"/var/www/pchart/fonts/calibri.ttf","FontSize"=>10,"R"=>255,"G"=>255,"B"=>255));
/* DIMENSIONI GRAFICO AERA INTERNA TRATTEGGIATA*/
$myData->setGraphArea(40,40,660,210);
$myData->drawGradientArea(0,0,700,241,DIRECTION_VERTICAL,array("StartR"=>0,"StartG"=>0,"StartB"=>0,"EndR"=>180,"EndG"=>180,"EndB"=>180,"Alpha"=>100));
/* Add a border to the picture */
/*$myData->drawRectangle(0,0,750,240,array("R"=>0,"G"=>0,"B"=>0));*/
$myData->drawText(250,30,"Umidita' e Dewpoint ultime 6h",array("FontSize"=>15,"Align"=>TEXT_ALIGN_BOTTOMLEFT,"DrawBox"=>TRUE,"BoxRounded"=>TRUE));
/* Write the chart legend */
$myData->drawLegend(535,30,array("Style"=>LEGEND_NOBORDER,"Mode"=>LEGEND_HORIZONTAL));
/* Compute and draw the scale */
$myData->drawScale(array("CycleBackground"=>TRUE,"DrawSubTicks"=>TRUE,"GridR"=>0,"GridG"=>0,"GridB"=>0,"GridAlpha"=>10,"LabelSkip"=>11,"XMargin"=>0));
$myData->drawFilledSplineChart();
/* Write the data bounds */
$myData->writeBounds($Type=BOUND_BOTH,array("DisplayColor"=>DISPLAY_MANUAL,"MaxDisplayR"=>255,"MaxDisplayG"=>0,"MaxDisplayB"=>0,"MinDisplayR"=>0,"MinDisplayG"=>0,"MinD$
$myData->setShadow(FALSE);
/* Build the PNG file and send it to the web browser */
$myData->Render("/var/www/dewumiditaF.png");
?>
|
| Fri Aug 26, 2011 12:41 pm |
|
|
|
jean-damien
Site Admin
Joined: Thu Dec 02, 2010 2:31 pm
Posts: 409
Location: France
|
Re: 2 series,one filled,one not filled,how?? Try something like this : Code: /* Draw the area chart */
$MyData->setSerieDrawable("Dewpoint",TRUE);
$MyData->setSerieDrawable("Umidita'",FALSE);
$myPicture->drawAreaChart();
/* Draw a line and a plot chart on top */
$MyData->setSerieDrawable("Umidita'",TRUE);
$myPicture->setShadow(TRUE,array("X"=>1,"Y"=>1,"R"=>0,"G"=>0,"B"=>0,"Alpha"=>10));
$myPicture->drawLineChart();
$myPicture->drawPlotChart(array("PlotBorder"=>TRUE,"PlotSize"=>3,"BorderSize"=>1,"Surrounding"=>-60,"BorderAlpha"=>80));
before : Code: $myData->Render("/var/www/dewumiditaF.png");
JD.
|
| Fri Aug 26, 2011 1:51 pm |
|
|
|
darko1984
pChart user
Joined: Fri Aug 26, 2011 9:44 am
Posts: 6
|
Re: 2 series,one filled,one not filled,how?? I have tried your code but i always receive this error
PHP Fatal error: Call to undefined method pImage::setSerieDrawable() in /var/www/dewumiditaF.php on line 74
The line 74 is
$myData->setSerieDrawable("Dewpoint",TRUE);
|
| Fri Aug 26, 2011 2:28 pm |
|
|
|
jean-damien
Site Admin
Joined: Thu Dec 02, 2010 2:31 pm
Posts: 409
Location: France
|
Re: 2 series,one filled,one not filled,how?? There is a mix of $MyData and $myData, just review the code and use the same variable on all calls ;o)
JD.
|
| Fri Aug 26, 2011 2:41 pm |
|
|
|
darko1984
pChart user
Joined: Fri Aug 26, 2011 9:44 am
Posts: 6
|
Re: 2 series,one filled,one not filled,how?? yea i know i correct it when i put on my php script,but the problem persist!
|
| Fri Aug 26, 2011 2:43 pm |
|
|
|
jean-damien
Site Admin
Joined: Thu Dec 02, 2010 2:31 pm
Posts: 409
Location: France
|
Re: 2 series,one filled,one not filled,how?? "undefined method" means : typo in the variable name or variable not well instanced. Send me the full code you're using in PM and I'll take a look.
JD.
|
| Fri Aug 26, 2011 2:48 pm |
|
|
|
|
Page 1 of 1
|
[ 8 posts ] |
|
Who is online |
Users browsing this forum: No registered users and 2 guests |
|
You cannot post new topics in this forum
You cannot reply to topics in this forum
You cannot edit your posts in this forum
You cannot delete your posts in this forum
You cannot post attachments in this forum
|
|
|
