 |

|
Page 1 of 1
|
[ 3 posts ] |
|
[PATCH] Zone Chart fails with VOID data points
| Author |
Message |
|
nate
New pChart user
Joined: Tue Dec 27, 2011 9:38 pm
Posts: 3
|
 [PATCH] Zone Chart fails with VOID data points Zone charts will render incorrectly with VOID data points. A patch has been provided. Before and After pictures have also been posted. Code: --- pDraw.class.php.orig 2011-12-27 09:27:44.011810124 -0700
+++ pDraw.class.php.fixed 2011-12-27 10:01:56.563830357 -0700
@@ -3852,62 +3852,83 @@
$PosArrayB = $this->scaleComputeY($SerieBData,array("AxisID"=>$AxisID));
if ( count($PosArrayA) != count($PosArrayB) ) { return(0); }
- if ( $Data["Orientation"] == SCALE_POS_LEFTRIGHT )
- {
- if ( $XDivs == 0 ) { $XStep = ($this->GraphAreaX2-$this->GraphAreaX1)/4; } else { $XStep = ($this->GraphAreaX2-$this->GraphAreaX1-$XMargin*2)/$XDivs; }
- $X = $this->GraphAreaX1 + $XMargin; $LastX = NULL; $LastY = NULL;
-
- $LastX = NULL; $LastY1 = NULL; $LastY2 = NULL;
- $BoundsA = ""; $BoundsB = "";
- foreach($PosArrayA as $Key => $Y1)
- {
- $Y2 = $PosArrayB[$Key];
-
- $BoundsA[] = $X; $BoundsA[] = $Y1;
- $BoundsB[] = $X; $BoundsB[] = $Y2;
-
- $LastX = $X;
- $LastY1 = $Y1; $LastY2 = $Y2;
-
- $X = $X + $XStep;
- }
- $Bounds = array_merge($BoundsA,$this->reversePlots($BoundsB));
- $this->drawPolygonChart($Bounds,array("R"=>$AreaR,"G"=>$AreaG,"B"=>$AreaB,"Alpha"=>$AreaAlpha));
-
- for($i=0;$i<=count($BoundsA)-4;$i=$i+2)
- {
- $this->drawLine($BoundsA[$i],$BoundsA[$i+1],$BoundsA[$i+2],$BoundsA[$i+3],array("R"=>$LineR,"G"=>$LineG,"B"=>$LineB,"Alpha"=>$LineAlpha,"Ticks"=>$LineTicks));
- $this->drawLine($BoundsB[$i],$BoundsB[$i+1],$BoundsB[$i+2],$BoundsB[$i+3],array("R"=>$LineR,"G"=>$LineG,"B"=>$LineB,"Alpha"=>$LineAlpha,"Ticks"=>$LineTicks));
- }
- }
- else
- {
- if ( $XDivs == 0 ) { $YStep = ($this->GraphAreaY2-$this->GraphAreaY1)/4; } else { $YStep = ($this->GraphAreaY2-$this->GraphAreaY1-$XMargin*2)/$XDivs; }
- $Y = $this->GraphAreaY1 + $XMargin; $LastX = NULL; $LastY = NULL;
-
- $LastY = NULL; $LastX1 = NULL; $LastX2 = NULL;
- $BoundsA = ""; $BoundsB = "";
- foreach($PosArrayA as $Key => $X1)
- {
- $X2 = $PosArrayB[$Key];
-
- $BoundsA[] = $X1; $BoundsA[] = $Y;
- $BoundsB[] = $X2; $BoundsB[] = $Y;
-
- $LastY = $Y;
- $LastX1 = $X1; $LastX2 = $X2;
-
- $Y = $Y + $YStep;
- }
- $Bounds = array_merge($BoundsA,$this->reversePlots($BoundsB));
- $this->drawPolygonChart($Bounds,array("R"=>$AreaR,"G"=>$AreaG,"B"=>$AreaB,"Alpha"=>$AreaAlpha));
-
- for($i=0;$i<=count($BoundsA)-4;$i=$i+2)
- {
- $this->drawLine($BoundsA[$i],$BoundsA[$i+1],$BoundsA[$i+2],$BoundsA[$i+3],array("R"=>$LineR,"G"=>$LineG,"B"=>$LineB,"Alpha"=>$LineAlpha,"Ticks"=>$LineTicks));
- $this->drawLine($BoundsB[$i],$BoundsB[$i+1],$BoundsB[$i+2],$BoundsB[$i+3],array("R"=>$LineR,"G"=>$LineG,"B"=>$LineB,"Alpha"=>$LineAlpha,"Ticks"=>$LineTicks));
- }
- }
+ $LastX = NULL; $LastY1 = NULL; $LastY2 = NULL;
+ $LastY = NULL; $LastX1 = NULL; $LastX2 = NULL;
+ $X = NULL; $Y = NULL;
+
+ if ( $XDivs == 0 ) { $XStep = ($this->GraphAreaX2-$this->GraphAreaX1)/4; } else { $XStep = ($this->GraphAreaX2-$this->GraphAreaX1-$XMargin*2)/$XDivs; }
+ $X = $this->GraphAreaX1 + $XMargin;
+ if ( $XDivs == 0 ) { $YStep = ($this->GraphAreaY2-$this->GraphAreaY1)/4; } else { $YStep = ($this->GraphAreaY2-$this->GraphAreaY1-$XMargin*2)/$XDivs; }
+ $Y = $this->GraphAreaY1 + $XMargin;
+
+ do
+ {
+ $BoundsA = array(); $BoundsB = array();
+ $keys = array_keys($PosArrayA);
+
+ if ( $Data["Orientation"] == SCALE_POS_LEFTRIGHT )
+ {
+ foreach($keys as $Key)
+ {
+ $Y1 = $PosArrayA[$Key];
+ $Y2 = $PosArrayB[$Key];
+
+ unset($PosArrayB[$Key]);
+ unset($PosArrayA[$Key]);
+
+ if($Y1 != VOID && $Y1 != VOID)
+ {
+ $BoundsA[] = $X; $BoundsA[] = $Y1;
+ $BoundsB[] = $X; $BoundsB[] = $Y2;
+ }
+
+ $LastX = $X;
+ $LastY1 = $Y1; $LastY2 = $Y2;
+
+ $X = $X + $XStep;
+
+ if($Y1 == VOID || $Y1 == VOID)
+ break;
+ }
+ }
+ else
+ {
+ foreach($keys as $Key)
+ {
+ $X1 = $PosArrayA[$Key];
+ $X2 = $PosArrayB[$Key];
+
+ unset($PosArrayB[$Key]);
+ unset($PosArrayA[$Key]);
+
+ if($X1 != VOID && $X1 != VOID)
+ {
+ $BoundsA[] = $X1; $BoundsA[] = $Y;
+ $BoundsB[] = $X2; $BoundsB[] = $Y;
+ }
+
+ $LastY = $Y;
+ $LastX1 = $X1; $LastX2 = $X2;
+
+ $Y = $Y + $YStep;
+
+ if($X1 == VOID || $X1 == VOID)
+ break;
+ }
+ }
+
+ if(count($BoundsA) > 0)
+ {
+ $Bounds = array_merge($BoundsA,$this->reversePlots($BoundsB));
+ $this->drawPolygonChart($Bounds,array("R"=>$AreaR,"G"=>$AreaG,"B"=>$AreaB,"Alpha"=>$AreaAlpha));
+
+ for($i=0;$i<=count($BoundsA)-4;$i=$i+2)
+ {
+ $this->drawLine($BoundsA[$i],$BoundsA[$i+1],$BoundsA[$i+2],$BoundsA[$i+3],array("R"=>$LineR,"G"=>$LineG,"B"=>$LineB,"Alpha"=>$LineAlpha,"Ticks"=>$LineTicks));
+ $this->drawLine($BoundsB[$i],$BoundsB[$i+1],$BoundsB[$i+2],$BoundsB[$i+3],array("R"=>$LineR,"G"=>$LineG,"B"=>$LineB,"Alpha"=>$LineAlpha,"Ticks"=>$LineTicks));
+ }
+ }
+ } while(count($PosArrayA) > 0);
}
/* Draw a step chart */
@@ -6190,4 +6211,4 @@
}
}
-?>
\ No newline at end of file
+?>
Attachments:
File comment: Zone Chart with VOID data points (patched pchart)
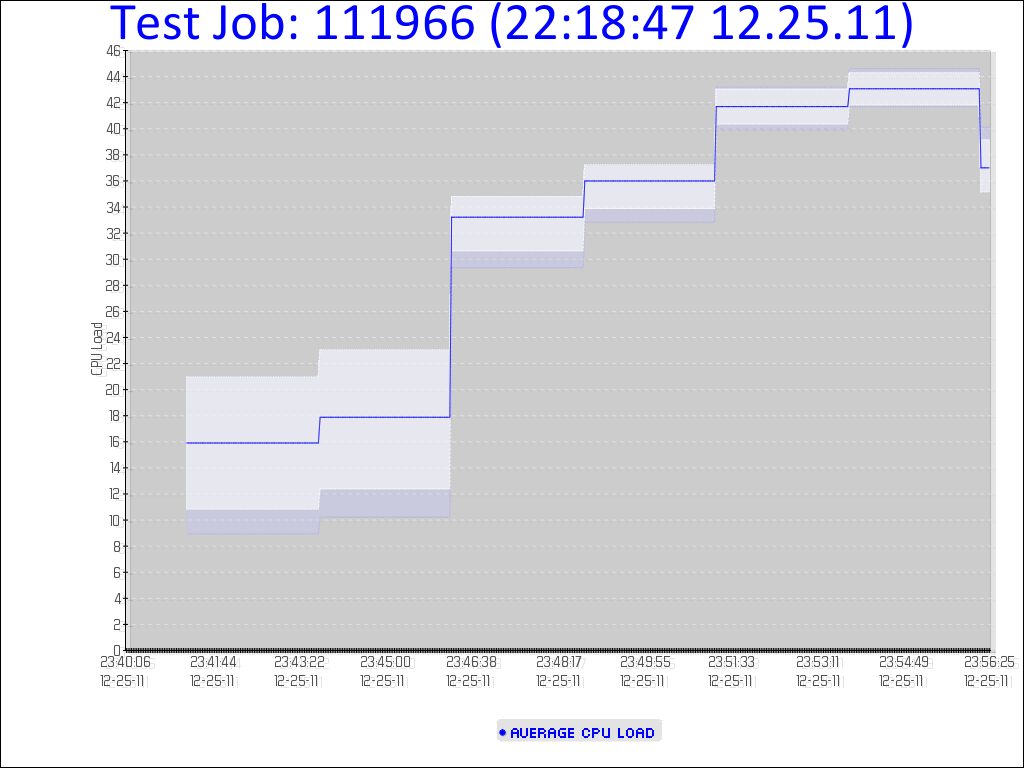 job_fixed.png [ 55.3 KiB | Viewed 6100 times ]
File comment: Zone Chart with VOID data points (vanilla pchart)
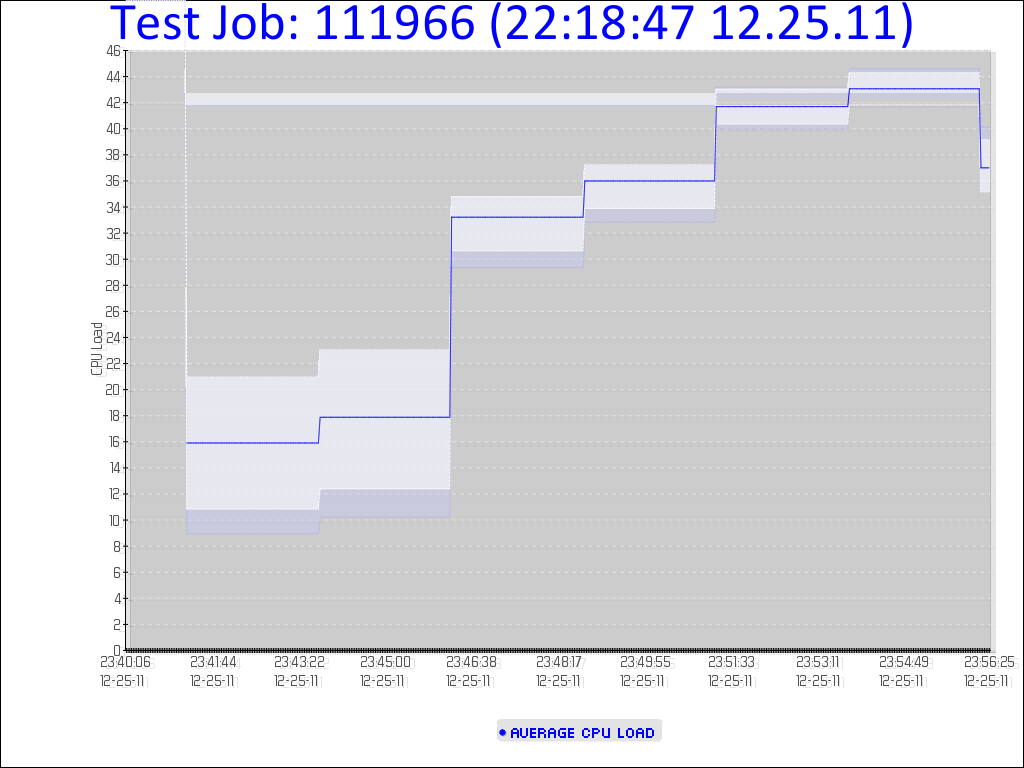 job_broke.png [ 59.51 KiB | Viewed 6100 times ]
|
| Tue Dec 27, 2011 9:48 pm |

|
|
|
mila76
Regular pChart user
Joined: Mon Dec 19, 2011 12:19 am
Posts: 14
|
Re: [PATCH] Zone Chart fails with VOID data points i haven't make no test but reading your code i think that's some mistake in this patch: Code: if($Y1 != VOID && $Y1 != VOID)
if($X1 != VOID && $X1 != VOID)
maybe Y1 => Y2 and X1 => X2 ?
|
| Thu Jan 05, 2012 3:13 am |
|
|
|
nate
New pChart user
Joined: Tue Dec 27, 2011 9:38 pm
Posts: 3
|
Re: [PATCH] Zone Chart fails with VOID data points mila76 wrote: i haven't make no test but reading your code i think that's some mistake in this patch: Code: if($Y1 != VOID && $Y1 != VOID)
if($X1 != VOID && $X1 != VOID)
maybe Y1 => Y2 and X1 => X2 ? The code has been modified to ignore VOID values sanely. Not sure what you mean by comparing the coordinates, is another check needed?
|
| Thu Jan 26, 2012 10:40 pm |
|
|
|
|
Page 1 of 1
|
[ 3 posts ] |
|
Who is online |
Users browsing this forum: No registered users and 10 guests |
|
You cannot post new topics in this forum
You cannot reply to topics in this forum
You cannot edit your posts in this forum
You cannot delete your posts in this forum
You cannot post attachments in this forum
|

|
|