|
ortizj
New pChart user
Joined: Sun Jan 01, 2012 1:26 pm
Posts: 1

|
 setSerieWeight does not work if setSerieTicks is not set? Hi there,
I'm trying to set the weight of a solid line (no ticks) but setSerieWeight only works when setSerieTicks is set to a value bigger than 0. If this is the right outcome, how can I set the weight of a solid line?
e.g.
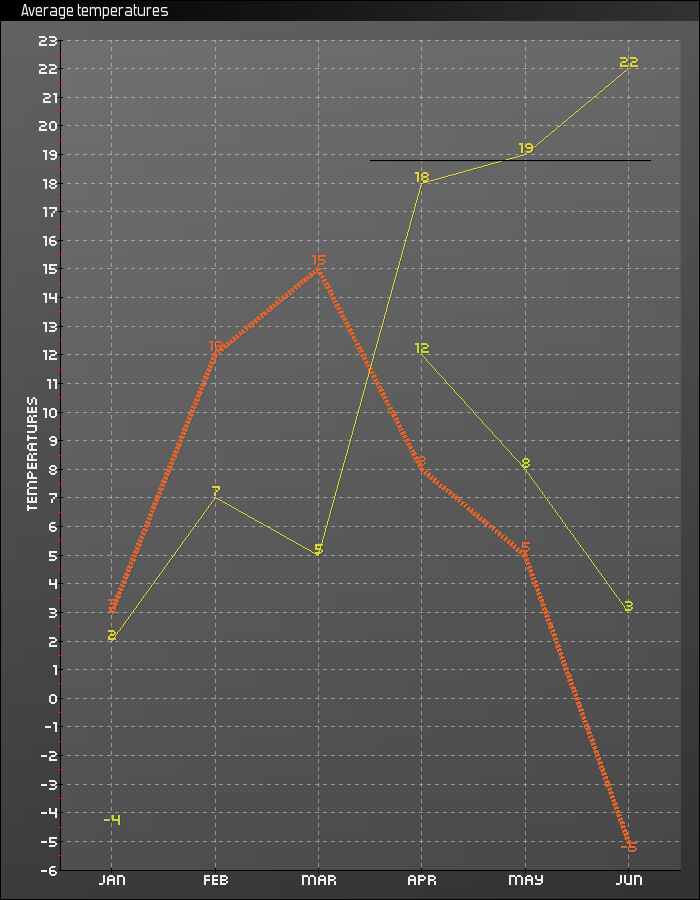
I get the resulting graph (grafica_test2_A.png, attached) with the following code:
--start code--
// pChart library inclusions
include("../class/pData.class.php");
include("../class/pDraw.class.php");
include("../class/pImage.class.php");
// Create and populate the pData object
$MyData = new pData();
$MyData->addPoints(array(-4,VOID,VOID,12,8,3),"Probe 1");
$MyData->addPoints(array(3,12,15,8,5,-5),"Probe 2");
$MyData->addPoints(array(2,7,5,18,19,22),"Probe 3");
$MyData->setSerieWeight("Probe 2",2);
$MyData->setSerieTicks("Probe 3",2);
$MyData->setAxisName(0,"Temperatures");
$MyData->addPoints(array("Jan","Feb","Mar","Apr","May","Jun"),"Labels");
$MyData->setSerieDescription("Labels","Months");
$MyData->setAbscissa("Labels");
// Create the pChart object
$myPicture = new pImage(700,900,$MyData);
// $myPicture->setGraphArea(20,40,680,880);
$myPicture->drawGradientArea(0,0,700,900,DIRECTION_VERTICAL,array("StartR"=>100,"StartG"=>100,"StartB"=>100,"EndR"=>50,"EndG"=>50,"EndB"=>50,"Alpha"=>100));
$myPicture->drawGradientArea(0,0,700,900,DIRECTION_HORIZONTAL,array("StartR"=>100,"StartG"=>100,"StartB"=>100,"EndR"=>50,"EndG"=>50,"EndB"=>50,"Alpha"=>20));
$myPicture->drawGradientArea(0,0,700,20,DIRECTION_HORIZONTAL,array("StartR"=>0,"StartG"=>0,"StartB"=>0,"EndR"=>50,"EndG"=>50,"EndB"=>50,"Alpha"=>100));
// Turn of Antialiasing
$myPicture->Antialias = FALSE;
// Add a border to the picture
$myPicture->drawRectangle(0,0,699,899,array("R"=>0,"G"=>0,"B"=>0));
// Add a border to the graph
// $myPicture->drawRectangle(20,40,680,880,array("R"=>255,"G"=>255,"B"=>255));
// Write the chart title
$myPicture->setFontProperties(array("FontName"=>"../fonts/Forgotte.ttf","FontSize"=>15,"R"=>240,"G"=>240,"B"=>240));
$myPicture->drawText(20,3,"Average temperatures",array("FontSize"=>15,"Align"=>TEXT_ALIGN_TOPLEFT));
// Set the default font
$myPicture->setFontProperties(array("FontName"=>"../fonts/pf_arma_five.ttf","FontSize"=>12));
$myPicture->setGraphArea(60,40,680,870);
$myPicture->drawFilledRectangle(60,40,680,870,array("R"=>255,"G"=>255,"B"=>255,"Surrounding"=>-200,"Alpha"=>10));
$myPicture->drawScale(array("DrawSubTicks"=>TRUE));
$myPicture->setShadow(TRUE,array("X"=>1,"Y"=>1,"R"=>0,"G"=>0,"B"=>0,"Alpha"=>10));
$myPicture->drawLineChart(array("DisplayValues"=>TRUE,"DisplayColor"=>DISPLAY_AUTO));
$myPicture->drawLine(370,160,650,160,array("R"=>0,"G"=>0,"B"=>0,"Weight"=>30));
$myPicture->autoOutput("pictures/grafica_test2.png");
--end of code--
When I change line
$MyData->setSerieTicks("Probe 3",2);
with:
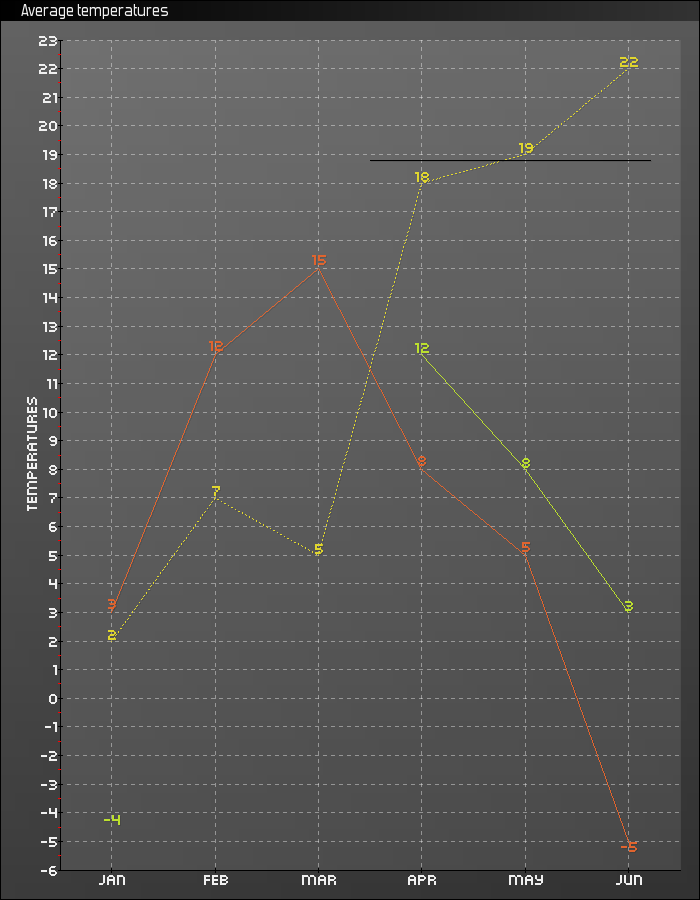
$MyData->setSerieTicks("Probe 2",2);
Then I get: grafica_test_B.png (attached).
Is the function setSerieWeight not meant to work without Ticks?
Thanks for your help.
Regards,
Attachments:
 grafica_test2_B.png [ 36.09 KiB | Viewed 4733 times ]
 grafica_test2_A.png [ 32.65 KiB | Viewed 4733 times ]
|