 |

|
Page 1 of 1
|
[ 3 posts ] |
|
| Author |
Message |
|
dmiller
New pChart user
Joined: Fri Mar 25, 2011 8:54 pm
Posts: 2
|
 Area Chart Bug? I've been trying to graph some live data coming in. It's a month view, with 'hours per day' that our sensors were tripped. The anomaly comes in the form of a phantom line originating from the origin of the area chart graph. See the attached picture. I am guessing that it comes from both of the serie starting with VOID for a considerable time? I have other data streams that have months/years worth of data and it never encounters VOID on these data sets (so, never see this glitch). We only see this on newly commissioned sensors prior to a full months of data collection. The code below should recreate the error: Code: <?php
include("class/pData.class.php");
include("class/pDraw.class.php");
include("class/pImage.class.php");
$myData = new pData();
$dataArray = Array(
'abscissa' => Array(
0 => '2011-02-24',
1 => '2011-02-25',
2 => '2011-02-26',
3 => '2011-02-27',
4 => '2011-02-28',
5 => '2011-03-01',
6 => '2011-03-02',
7 => '2011-03-03',
8 => '2011-03-04',
9 => '2011-03-05',
10 => '2011-03-06',
11 => '2011-03-07',
12 => '2011-03-08',
13 => '2011-03-09',
14 => '2011-03-10',
15 => '2011-03-11',
16 => '2011-03-12',
17 => '2011-03-13',
18 => '2011-03-14',
19 => '2011-03-15',
20 => '2011-03-16',
21 => '2011-03-17',
22 => '2011-03-18',
23 => '2011-03-19',
24 => '2011-03-20',
25 => '2011-03-21',
26 => '2011-03-22',
27 => '2011-03-23',
28 => '2011-03-24',
29 => '2011-03-25'),
'fan' => Array(
0 => VOID,
1 => VOID,
2 => VOID,
3 => VOID,
4 => VOID,
5 => VOID,
6 => VOID,
7 => VOID,
8 => VOID,
9 => VOID,
10 => VOID,
11 => 10,
12 => 12,
13 => 8,
14 => 3,
15 => 5,
16 => 6,
17 => 7,
18 => 0,
19 => 5,
20 => 0,
21 => 12,
22 => 4,
23 => 16,
24 => 17,
25 => 8,
26 => 5,
27 => 24,
28 => 5,
29 => VOID),
'heater' => Array(
0 => VOID,
1 => VOID,
2 => VOID,
3 => VOID,
4 => VOID,
5 => VOID,
6 => VOID,
7 => VOID,
8 => VOID,
9 => VOID,
10 => VOID,
11 => 2,
12 => 7,
13 => 12,
14 => 14,
15 => 5,
16 => 6,
17 => 6,
18 => 0,
19 => 0,
20 => 4,
21 => 6,
22 => 7,
23 => 12,
24 => 12,
25 => 16,
26 => 0,
27 => 0,
28 => 12,
29 => VOID)
);
// Fan points.
$myData->addPoints($dataArray['fan'],"Serie1");
$myData->setSerieDescription("Serie1","Fan");
$myData->setSerieOnAxis("Serie1",0);
$color = array("R"=>0,"G"=>0,"B"=>255);
$myData->setPalette("Serie1", $color);
// Heater points.
$myData->addPoints($dataArray['heater'],"Serie2");
$myData->setSerieDescription("Serie2","Heater");
$myData->setSerieOnAxis("Serie2",0);
$color = array("R"=>255,"G"=>0,"B"=>0);
$myData->setPalette("Serie2", $color);
// Make use of our 'abscissa' key now.
$myData->addPoints($dataArray['abscissa'],"Dates");
$myData->setAbscissa("Dates");
$myData->setAxisPosition(0,AXIS_POSITION_LEFT);
// Draw main filled rectangle.
$myPicture = new pImage(700,275,$myData);
$Settings = array("R"=>245, "G"=>245, "B"=>245, "Dash"=>0, "DashR"=>265, "DashG"=>265, "DashB"=>265);
$myPicture->drawFilledRectangle(0,0,700,275,$Settings);
// Draw the border on the main rectangle.
$myPicture->drawRectangle(0,0,699,274,array("R"=>0,"G"=>0,"B"=>0));
// Graph Title
$myPicture->setShadow(TRUE,array("X"=>1,"Y"=>1,"R"=>50,"G"=>50,"B"=>50,"Alpha"=>20));
$myPicture->setFontProperties(array("FontName"=>"fonts/Forgotte.ttf","FontSize"=>18));
$TextSettings = array("Align"=>TEXT_ALIGN_MIDDLEMIDDLE, "R"=>0, "G"=>0, "B"=>0);
$myPicture->drawText(350,25,"Fan and Heater Runtime",$TextSettings);
// Graph Area
$myPicture->setGraphArea(75,50,605,190);
// Reset font properties.
$myPicture->setShadow(FALSE);
$myPicture->setFontProperties(array("R"=>0,"G"=>0,"B"=>0,"FontName"=>"fonts/verdana.ttf","FontSize"=>8));
$AxisBoundaries = array(0=>array("Min"=>0,"Max"=>24));
$Settings = array("Pos"=>SCALE_POS_LEFTRIGHT, "Mode"=>SCALE_MODE_MANUAL, "ManualScale"=>$AxisBoundaries, "LabelingMethod"=>LABELING_ALL, "GridR"=>180, "GridG"=>180, "GridB"=>180, "GridAlpha"=>50, "TickR"=>0, "TickG"=>0, "TickB"=>0, "TickAlpha"=>50, "LabelRotation"=>55, "LabelSkip"=>1.5, "CycleBackground"=>1, "DrawXLines"=>1, "DrawSubTicks"=>1, "SubTickR"=>125, "SubTickG"=>125, "SubTickB"=>125, "SubTickAlpha"=>50, "SkippedTickR"=>125, "SkippedTickG"=>125, "SkippedTickB"=>125, "SkippedTickAlpha"=>50, "SkippedOuterTickWidth"=>3, "YMargin"=>0, "MinDivHeight"=>11, "DrawYLines"=>ALL);
$myPicture->drawScale($Settings);
$myPicture->setShadow(TRUE,array("X"=>1,"Y"=>1,"R"=>50,"G"=>50,"B"=>50,"Alpha"=>10));
$Config = array("AroundZero"=>1);
$myPicture->drawAreaChart($Config);
$Config = array("FontR"=>0, "FontG"=>0, "FontB"=>0, "FontName"=>"pfonts/pf_arma_five.ttf", "FontSize"=>8, "R"=>251, "G"=>251, "B"=>251, "Alpha"=>100, "Margin"=>10, "BoxSize"=>5, "Style"=>LEGEND_BOX, "Mode"=>LEGEND_VERTICAL, "Family"=>LEGEND_FAMILY_CIRCLE);
$myPicture->drawLegend(632,102,$Config);
$myPicture->stroke();
Attachments:
File comment: Protrusion on the lower left hand corner.
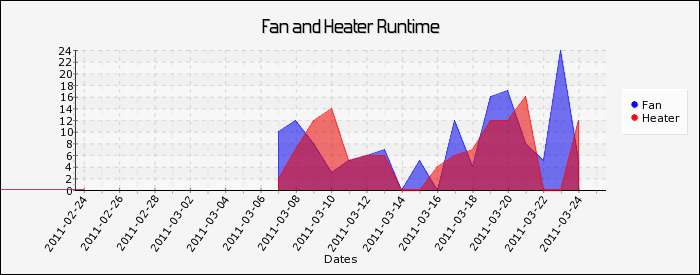 testing.png [ 29.29 KiB | Viewed 6884 times ]
|
| Fri Mar 25, 2011 9:30 pm |

|
|
|
dmiller
New pChart user
Joined: Fri Mar 25, 2011 8:54 pm
Posts: 2
|
Re: Area Chart Bug? OK guys. I got tired of this bug, and fixed it. Here's the proper code to correct this issue: This goes in pDraw.class.php around line 3700. It should be fairly straight forward to find. Old code: Code: if ( $Y == VOID && isset($Areas[$AreaID]) )
{
$Areas[$AreaID][] = $LastX;
if ( $AroundZero ) { $Areas[$AreaID][] = $YZero; } else { $Areas[$AreaID][] = $this->GraphAreaY2-1; }
$AreaID++;
}
New code: Code: if ( $Y == VOID && isset($Areas[$AreaID]) )
{
if($LastX == NULL)
{
$Areas[$AreaID][] = $X;
}
else
{
$Areas[$AreaID][] = $LastX;
}
if ( $AroundZero ) { $Areas[$AreaID][] = $YZero; } else { $Areas[$AreaID][] = $this->GraphAreaY2-1; }
$AreaID++;
}
It looks like there was just a simple miss to check for NULL values that should only happen on the very first time through. I hope that helps someone out there!
|
| Mon Jun 20, 2011 3:11 pm |
|
|
|
jean-damien
Site Admin
Joined: Thu Dec 02, 2010 2:31 pm
Posts: 409
Location: France
|
Re: Area Chart Bug? Hi,
I've integrated and tested this change with the two possible scale orientation and it works like a charm, thank you very much.
Kind regards,
JD.
|
| Mon Jun 20, 2011 3:20 pm |

|
|
|
|
Page 1 of 1
|
[ 3 posts ] |
|
Who is online |
Users browsing this forum: No registered users and 11 guests |
|
You cannot post new topics in this forum
You cannot reply to topics in this forum
You cannot edit your posts in this forum
You cannot delete your posts in this forum
You cannot post attachments in this forum
|

|
|
