Rotating spheres on charts. |
|
|
|
This request has been opened by : mice32alpha |
 |
Feature description |
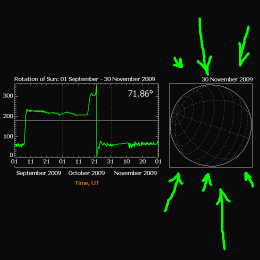
What about an extension to pChart, which would generate 3D spheres on charts? Something like that: http://tesis.lebedev.ru/orientation.html
|
Importance |
: |
 |
Low |
|
Status |
: |
Not started |
Key Feature |
: |
 |
Yes |
|
|
 |
Message from mice32alpha on 16/12/2010 |
Maybe code of pGeo.earth class will be useful there...
|
Message from Jean-Damien on 26/12/2010 |
pGeo is able to make projection of 2D surface maps (-180/+180,-90,+90) on 3D spherical objects. It cannot work directly with 3D coordinates.
I believe that such graph would be better coded directly in the pGeo class that may become a pChart extension.
|  |
To post wishes add comments or vote, you must be logged. To create an account use the Register link on top of this page.
| |