 |

|
Page 1 of 1
|
[ 3 posts ] |
|
| Author |
Message |
|
Einbischen
pChart user
Joined: Wed Feb 09, 2011 12:46 pm
Posts: 5
|
 setAbscissaColor ? hi is there an option to set a different "AbscissaColor" ? I searched for an hour ( http://wiki.pchart.net/) and didn't find anything (I hope there's not such a function, otherwise shame on me   ) I only found Code: $MyData->setAxisColor(0,array("R"=>255,"G"=>255,"B"=>255)); It's a bit confusing IMHO, because "setAxisColor" can stand for x and / or y. anyway thank you for your answers in advance best regards
|
| Wed Feb 09, 2011 1:41 pm |

|
|
|
jean-damien
Site Admin
Joined: Thu Dec 02, 2010 2:31 pm
Posts: 409
Location: France
|
 Re: setAbscissaColor ? That is correct, there is no way to set specifically the absissa axis color. Hopefully there is a workaround : you can use the AxisR,AxisG,AxisB parameters of the drawScale() function to define the default axis color : Code: /* pChart library inclusions */
include("../class/pData.class.php");
include("../class/pDraw.class.php");
include("../class/pImage.class.php");
/* Create and populate the pData object */
$MyData = new pData();
$MyData->addPoints(array(24,-25,26,25,25),"Temperature");
$MyData->addPoints(array(1,2,VOID,9,10),"Humidity 1");
$MyData->addPoints(array(1,VOID,7,-9,0),"Humidity 2");
$MyData->addPoints(array(-1,-1,-1,-1,-1),"Humidity 3");
$MyData->addPoints(array(0,0,0,0,0),"Vide");
$MyData->setSerieOnAxis("Temperature",0);
$MyData->setSerieOnAxis("Humidity 1",1);
$MyData->setSerieOnAxis("Humidity 2",1);
$MyData->setSerieOnAxis("Humidity 3",1);
$MyData->setSerieOnAxis("Vide",2);
$MyData->setAxisPosition(2,AXIS_POSITION_RIGHT);
$MyData->setAxisName(0,"Temperature");
$MyData->setAxisName(1,"Humidity");
$MyData->setAxisName(2,"Empty value");
/* Associate a color to each axis */
$MyData->setAxisColor(0,array("R"=>102,"G"=>129,"B"=>63));
$MyData->setAxisColor(1,array("R"=>129,"G"=>72,"B"=>63));
$MyData->setAxisColor(2,array("R"=>63,"G"=>89,"B"=>129));
/* Create the abscissa serie */
$MyData->addPoints(array("Jan","Feb","Mar","Apr","May","Jun"),"Labels");
$MyData->setSerieDescription("Labels","My labels");
$MyData->setAbscissa("Labels");
/* Create the pChart object */
$myPicture = new pImage(700,230,$MyData);
/* Draw the background */
$Settings = array("R"=>170, "G"=>183, "B"=>87, "Dash"=>1, "DashR"=>190, "DashG"=>203, "DashB"=>107);
$myPicture->drawFilledRectangle(0,0,700,230,$Settings);
/* Overlay with a gradient */
$Settings = array("StartR"=>219, "StartG"=>231, "StartB"=>139, "EndR"=>1, "EndG"=>138, "EndB"=>68, "Alpha"=>50);
$myPicture->drawGradientArea(0,0,700,230,DIRECTION_VERTICAL,$Settings);
$myPicture->drawGradientArea(0,0,700,20,DIRECTION_VERTICAL,array("StartR"=>0,"StartG"=>0,"StartB"=>0,"EndR"=>50,"EndG"=>50,"EndB"=>50,"Alpha"=>80));
/* Add a border to the picture */
$myPicture->drawRectangle(0,0,699,229,array("R"=>0,"G"=>0,"B"=>0));
/* Write the picture title */
$myPicture->setFontProperties(array("FontName"=>"../fonts/Silkscreen.ttf","FontSize"=>6));
$myPicture->drawText(10,13,"drawScale() - draw the X-Y scales",array("R"=>255,"G"=>255,"B"=>255));
/* Set the default font */
$myPicture->setFontProperties(array("FontName"=>"../fonts/Forgotte.ttf","FontSize"=>11));
/* Write the chart title */
$myPicture->setGraphArea(90,60,660,190);
$myPicture->drawText(350,55,"My chart title",array("FontSize"=>20,"Align"=>TEXT_ALIGN_BOTTOMMIDDLE));
$myPicture->drawFilledRectangle(90,60,660,190,array("R"=>255,"G"=>255,"B"=>255,"Surrounding"=>-200,"Alpha"=>10));
/* Draw the scale */
$Settings = array("AxisR"=>255,"AxisG"=>0,"AxisB"=>0,"DrawYLines"=>array(0),"Pos"=>SCALE_POS_LEFTRIGHT);
$myPicture->drawScale($Settings);
/* Render the picture (choose the best way) */
$myPicture->autoOutput("pictures/example.drawScale.color.png");
Attachments:
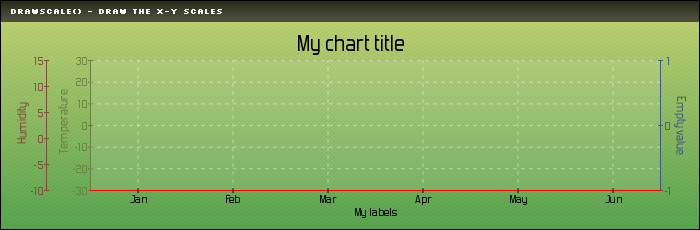 example.drawScale.color.png [ 18.31 KiB | Viewed 6268 times ]
|
| Wed Feb 09, 2011 2:24 pm |

|
|
|
Einbischen
pChart user
Joined: Wed Feb 09, 2011 12:46 pm
Posts: 5
|
Re: setAbscissaColor ? Thank you a lot ! that's awesome, now it looks fantastic  To set the text color on the X-Axis I used (just in case someone's got the same obstacle) Code: $myPicture->setFontProperties(array("FontName"=>"../fonts/tahoma.ttf","FontSize"=>8,"R"=>255,"G"=>255,"B"=>255));
|
| Wed Feb 09, 2011 4:16 pm |
|
|
|
|
Page 1 of 1
|
[ 3 posts ] |
|
Who is online |
Users browsing this forum: No registered users and 10 guests |
|
You cannot post new topics in this forum
You cannot reply to topics in this forum
You cannot edit your posts in this forum
You cannot delete your posts in this forum
You cannot post attachments in this forum
|

|
|
