 |

|
Page 1 of 1
|
[ 6 posts ] |
|
[bug] drawScale with drawStackedBarChart using ManualScale
| Author |
Message |
|
david.b
pChart user
Joined: Mon Feb 28, 2011 1:51 am
Posts: 6
|
 [bug] drawScale with drawStackedBarChart using ManualScale Hi, I have a problem with drawScale method. This is my graph: Attachment:
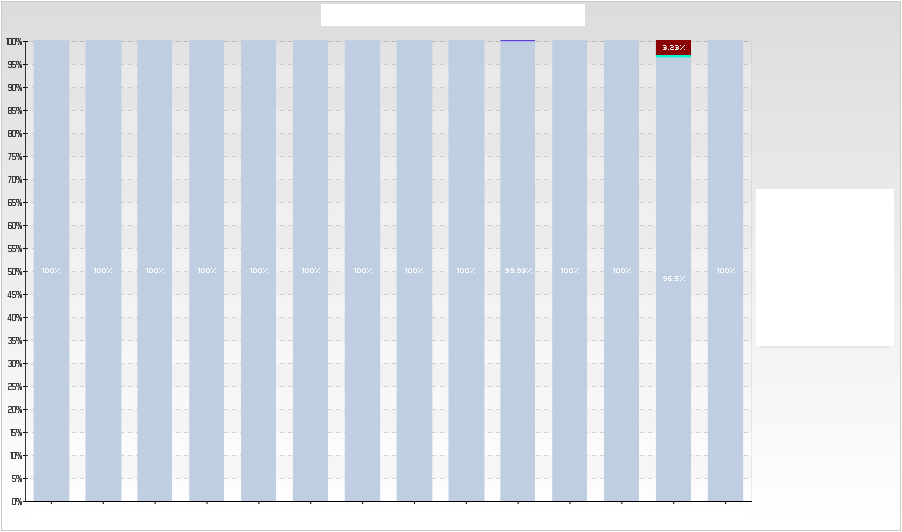 graph.PNG [ 29.38 KiB | Viewed 8737 times ]
with: Code: $AxisBoundaries = array(0=>array("Min"=>0,"Max"=>100));
$myPicture->drawScale(array("GridR"=>140,"GridG"=>140,"GridB"=>140,"Mode"=>SCALE_MODE_MANUAL,"ManualScale"=>$AxisBoundaries,"CycleBackground"=>TRUE)); And when I change Min value like this: Code: $AxisBoundaries = array(0=>array("Min"=>90,"Max"=>100));
$myPicture->drawScale(array("GridR"=>140,"GridG"=>140,"GridB"=>140,"Mode"=>SCALE_MODE_MANUAL,"ManualScale"=>$AxisBoundaries,"CycleBackground"=>TRUE)); I have this graph: Attachment:
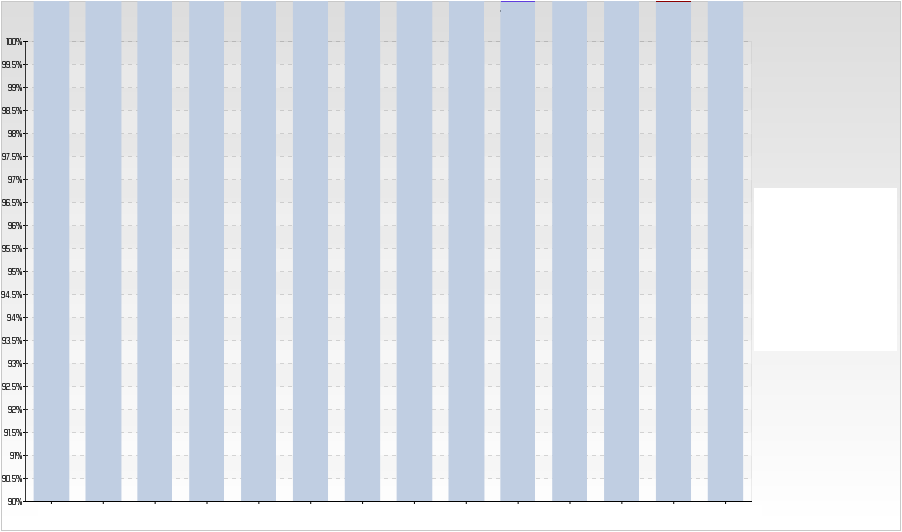 bug.PNG [ 30.36 KiB | Viewed 8737 times ]
It doesn't respect max Value, I don't have percent value in bars... How to resolve this problem? Thanks for your help.
Last edited by david.b on Thu Mar 17, 2011 12:01 pm, edited 2 times in total.
|
| Thu Mar 17, 2011 6:41 am |

|
|
|
david.b
pChart user
Joined: Mon Feb 28, 2011 1:51 am
Posts: 6
|
Re: Problem with drawScale and Axis Boundaries it seems to be a bug with drawStackedBarChart(). it works with drawBarChart(); I take an example of the wiki. Code: <?php
/* pChart library inclusions */
include("class/pData.class.php");
include("class/pDraw.class.php");
include("class/pImage.class.php");
/* Create and populate the pData object */
$MyData = new pData();
$MyData->addPoints(array(74,75,66,55,75),"Data");
$MyData->addPoints(array(26,25,34,45,25),"Data2");
$MyData->setAxisUnit(0,"%");
$MyData->setAxisDisplay(0,AXIS_FORMAT_DEFAULT);
$MyData->setAxisName(0,"Data");
$MyData->addPoints(array("Jan","Feb","Mar","Apr","May"),"Labels");
$MyData->setSerieDescription("Labels","");
$MyData->setAbscissa("Labels");
$MyData->setPalette("Data",array("R"=>192,"G"=>206,"B"=>226));
$MyData->setPalette("Data2",array("R"=>221,"G"=>62,"B"=>187));
$MyData->normalize(100,"%",2);
/* Create the pChart object */
$myPicture = new pImage(700,230,$MyData);
/* Draw the background */
$Settings = array("R"=>170, "G"=>183, "B"=>87, "Dash"=>1, "DashR"=>190, "DashG"=>203, "DashB"=>107);
$myPicture->drawFilledRectangle(0,0,700,230,$Settings);
/* Overlay with a gradient */
$Settings = array("StartR"=>219, "StartG"=>231, "StartB"=>139, "EndR"=>1, "EndG"=>138, "EndB"=>68, "Alpha"=>50);
$myPicture->drawGradientArea(0,0,700,230,DIRECTION_VERTICAL,$Settings);
$myPicture->drawGradientArea(0,0,700,20,DIRECTION_VERTICAL,array("StartR"=>0,"StartG"=>0,"StartB"=>0,"EndR"=>50,"EndG"=>50,"EndB"=>50,"Alpha"=>80));
/* Add a border to the picture */
$myPicture->drawRectangle(0,0,699,229,array("R"=>0,"G"=>0,"B"=>0));
/* Write the picture title */
$myPicture->setFontProperties(array("FontName"=>"fonts/Silkscreen.ttf","FontSize"=>6));
$myPicture->drawText(10,13,"drawScale() - draw the X-Y scales",array("R"=>255,"G"=>255,"B"=>255));
/* Set the default font */
$myPicture->setFontProperties(array("FontName"=>"fonts/Forgotte.ttf","FontSize"=>11));
/* Write the chart title */
$myPicture->setGraphArea(60,60,660,190);
$myPicture->drawText(350,55,"My chart title",array("FontSize"=>20,"Align"=>TEXT_ALIGN_BOTTOMMIDDLE));
$myPicture->drawFilledRectangle(60,60,660,190,array("R"=>255,"G"=>255,"B"=>255,"Surrounding"=>-200,"Alpha"=>10));
/* Set the default font */
$myPicture->setFontProperties(array("FontName"=>"fonts/pf_arma_five.ttf","FontSize"=>6));
/* Draw the scale */
$AxisBoundaries = array(0=>array("Min"=>20,"Max"=>100));
$ScaleSettings = array("Mode"=>SCALE_MODE_MANUAL,"ManualScale"=>$AxisBoundaries,"DrawSubTicks"=>TRUE,"DrawArrows"=>TRUE,"ArrowSize"=>6);
$myPicture->drawScale($ScaleSettings);
//$myPicture->drawBarChart(array("DisplayValues">TRUE,"DisplayColor"=>DISPLAY_AUTO));
$myPicture->drawStackedBarChart(array("DisplayValues"=>TRUE,"DisplayColor"=>DISPLAY_AUTO));
/* Render the picture (choose the best way) */
//$myPicture->autoOutput("pictures/example.drawScale.png");
$myPicture->stroke();
?>
Attachment:
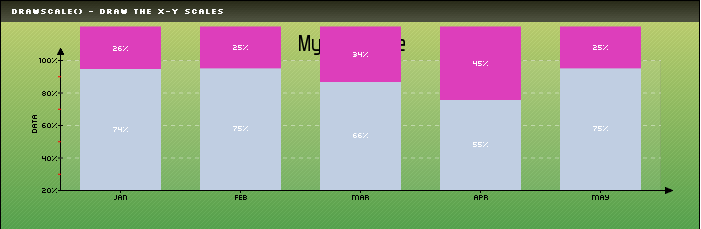 bug2.PNG [ 12.74 KiB | Viewed 8724 times ]
|
| Thu Mar 17, 2011 11:53 am |
|
|
|
david.b
pChart user
Joined: Mon Feb 28, 2011 1:51 am
Posts: 6
|
Re: [bug] drawScale with drawStackedBarChart using ManualSca Is there a workaround to this problem? 
|
| Sun Mar 20, 2011 11:20 pm |
|
|
|
jean-damien
Site Admin
Joined: Thu Dec 02, 2010 2:31 pm
Posts: 409
Location: France
|
Re: [bug] drawScale with drawStackedBarChart using ManualSca Hi, The issue you're experiencing here is due to the fact that you are forcing the scale. the drawStackedBarChart() function has been designed to work with the SCALE_MODE_ADDALL scaling mode. ( drawStackedBarChart it is written at the top of the page) There is no plan yet to change this as it would involve the rewritting of this function. But I'll keep it in mind ;o) Kind regards, JD.
|
| Wed Mar 23, 2011 10:41 am |

|
|
|
smallet
New pChart user
Joined: Thu Mar 31, 2011 7:23 pm
Posts: 1
|
Re: [bug] drawScale with drawStackedBarChart using ManualSca Ok sure it works with "SCALE_MODE_ADDALL", but when you want to use "SCALE_MODE_START0" so that you don't see the negative values, well you can't do it, it shows values going above the max value all the time!
My chart shows the negative value now and it looks stupid...
maybe you should re-write your function so that SCALE_MODE_START0 works as well =)
Thanks.
|
| Thu Mar 31, 2011 7:25 pm |
|
|
|
jean-damien
Site Admin
Joined: Thu Dec 02, 2010 2:31 pm
Posts: 409
Location: France
|
Re: [bug] drawScale with drawStackedBarChart using ManualSca Regarding the negative values
I'm not sure to understand your point here. The drawStackedBarChart() function works as expected by adding all the series values at the same single X slot. If you got negative values, then they're display as negative and can be stacked negatively: this is the way a stacked bar chart is drawn.
If it looks stupid on your chart then you'll have to reconsider your dataset by replacing the negative values -that you don't seem to want- by the VOID keyword.
Regarding the use of another scaling method
This function will never work with SCALE_MODE_START0 and the explanation is really simple: the scale is drawn before the chart. With standard charts (line, cubic, plot, bars,..) to determine the scaling boundaries, you just have to find the overall max & min values of all series. With stacked charts, the philosophy is a bit different as you need to compute the sum of each values at each X slots to determine the overall max & min values: this result in bigger boundaries that would not fit for standards charts.
This is why you need to explicitly specify the SCALE_MODE_ADDALL or SCALE_MODE_ADDALL_START0.
Using the SCALE_MODE_START0, the max boundaries will be inferior of the real max value for a stacked chart resulting in out-of-scale bars
drawing.
Kind regards,
JD.
|
| Fri Apr 01, 2011 7:33 am |
|
|
|
|
Page 1 of 1
|
[ 6 posts ] |
|
Who is online |
Users browsing this forum: No registered users and 16 guests |
|
You cannot post new topics in this forum
You cannot reply to topics in this forum
You cannot edit your posts in this forum
You cannot delete your posts in this forum
You cannot post attachments in this forum
|

|
|
