|
Language Reference » Charting functions » drawStackedBarChart
|
|
Latest updates
Toolbox
Google AdSense
|
drawStackedBarChart - Draw a bar chart This function allows you to draw a stacked bar chart. All the drawing parameters are given trough a $Format array. To learn more about this please read the Format array guide.
Calling this function
drawStackedBarChart($Format="");Where : Format is an array containing the drawing parameters of the chart. Customisation array - Tune up your chart! It is possible to customize the stacked bar chart rendering by playing with this array. Providing a detailled configuration is not mandatory. You can specify if the values must be written on the chart setting DisplayValues to TRUE or FALSE.
You can specify the labels color with DisplayR,DisplayG,DisplayB.
You can specify if the area are wrapped around the 0 line setting AroundZero to TRUE.
You can specify the interleave between two bars with Interleave (default is .5)
You can draw area with rounded corners setting Rounded to TRUE.
You can specify an unique border color with BorderR,BorderG,BorderB,.
You can use the Surrounding option to define the border color. This value will be added to the R,G,B factors to define the border color.
You can draw the bars with a gradient overlay setting Gradient to TRUE.
You can specify the gradient starting color with GradientStartR,GradientStartG,GradientStartB.
You can specify the gradient ending color with GradientEndR,GradientEndG,GradientEndtB.
You can specify the gradient alpha with GradientAlpha.
You can draw an inner overlay setting a factor to InnerSurrounding. This value will be added to the R,G,B bar values to define the inner border color.
You can enable image map recording by setting RecordImageMap to TRUE.
You can specify statically the inner border color with InnerBorderR,InnerBorderG,InnerBorderB. You can define if the labels color will be the same than the serie color of if you want to force it manually setting DisplayColor to : DISPLAY_MANUAL, color will be specified manually with DisplayR,DisplayG,DisplayB.
DISPLAY_AUTO, will use the serie color. The default gradient overlay (if you only set Gradient to TRUE) will be a white to black with 40% alpha. You can define the orientation of the labels setting DisplayOrientation to : ORIENTATION_AUTO, to let the library decide the best orientation.
ORIENTATION_HORIZONTAL, to force an horizontal orientation.
ORIENTATION_VERTICAL, to force a vertical orientation. Sample script 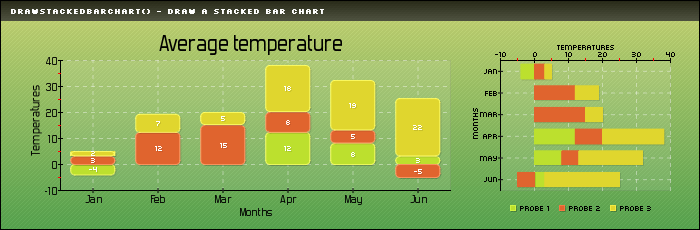
 /* Build a dataset */
 $MyData = new pData();
 $MyData->addPoints(array(-4,VOID,VOID,12,8,3),"Probe 1");
 $MyData->addPoints(array(3,12,15,8,5,-5),"Probe 2");
 $MyData->addPoints(array(2,7,5,18,19,22),"Probe 3");
 $MyData->setSerieTicks("Probe 2",4);
 $MyData->setAxisName(0,"Temperatures");
 $MyData->addPoints(array("Jan","Feb","Mar","Apr","May","Jun"),"Labels");
 $MyData->setSerieDescription("Labels","Months");
 $MyData->setAbscissa("Labels");

 /* Create the 1st chart*/
 $myPicture->setGraphArea(60,60,450,190);
 $myPicture->drawFilledRectangle(60,60,450,190,array("R"=>255,"G"=>255,"B"=>255,"Surrounding"=>-200,"Alpha"=>10));
 $myPicture->drawScale(array("DrawSubTicks"=>TRUE,"Mode"=>SCALE_MODE_ADDALL));
 $myPicture->setShadow(TRUE,array("X"=>1,"Y"=>1,"R"=>0,"G"=>0,"B"=>0,"Alpha"=>10));
 $myPicture->setFontProperties(array("FontName"=>"fonts/pf_arma_five.ttf","FontSize"=>6));
 $myPicture->drawStackedBarChart(array("DisplayValues"=>TRUE,"DisplayColor"=>DISPLAY_AUTO,"Rounded"=>TRUE,"Surrounding"=>60));
 $myPicture->setShadow(FALSE);

 /* Create the 2nd chart */
 $myPicture->setGraphArea(500,60,670,190);
 $myPicture->drawFilledRectangle(500,60,670,190,array("R"=>255,"G"=>255,"B"=>255,"Surrounding"=>-200,"Alpha"=>10));
 $myPicture->drawScale(array("Pos"=>SCALE_POS_TOPBOTTOM,"DrawSubTicks"=>TRUE,"Mode"=>SCALE_MODE_ADDALL));
 $myPicture->setShadow(TRUE,array("X"=>1,"Y"=>1,"R"=>0,"G"=>0,"B"=>0,"Alpha"=>10));
 $myPicture->drawStackedBarChart();
 $myPicture->setShadow(FALSE);

 /* Write the legend*/
 $myPicture->drawLegend(510,205,array("Style"=>LEGEND_NOBORDER,"Mode"=>LEGEND_HORIZONTAL));
Second Sample script 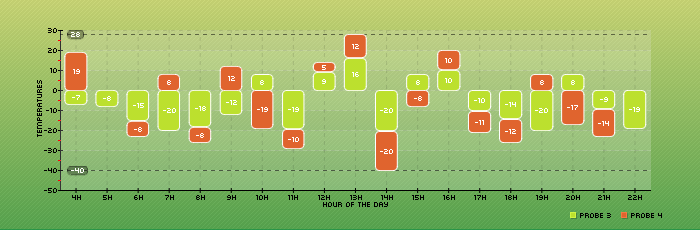
 /* pChart library inclusions */
 include("../class/pData.class.php");
 include("../class/pDraw.class.php");
 include("../class/pImage.class.php");

 /* Create and populate the pData object */
 $MyData = new pData();
 $MyData->addPoints(array(-7,-8,-15,-20,-18,-12,8,-19,9,16,-20,8,10,-10,-14,-20,8,-9,-19),"Probe 3");
 $MyData->addPoints(array(19,0,-8,8,-8,12,-19,-10,5,12,-20,-8,10,-11,-12,8,-17,-14,0),"Probe 4");
 $MyData->setAxisName(0,"Temperatures");
 $MyData->addPoints(array(4,5,6,7,8,9,10,11,12,13,14,15,16,17,18,19,20,21,22),"Time");
 $MyData->setSerieDescription("Time","Hour of the day");
 $MyData->setAbscissa("Time");
 $MyData->setXAxisUnit("h");

 /* Create the pChart object */
 $myPicture = new pImage(700,230,$MyData);

 /* Draw the background */
 $Settings = array("R"=>170, "G"=>183, "B"=>87, "Dash"=>1, "DashR"=>190, "DashG"=>203, "DashB"=>107);
 $myPicture->drawFilledRectangle(0,0,700,230,$Settings);

 /* Overlay with a gradient */
 $Settings = array("StartR"=>219, "StartG"=>231, "StartB"=>139, "EndR"=>1, "EndG"=>138, "EndB"=>68, "Alpha"=>50);
 $myPicture->drawGradientArea(0,0,700,230,DIRECTION_VERTICAL,$Settings);

 /* Set the default font properties */
 $myPicture->setFontProperties(array("FontName"=>"../fonts/pf_arma_five.ttf","FontSize"=>6));

 /* Draw the scale */
 $myPicture->setGraphArea(60,30,650,190);
 $myPicture->drawScale(array("CycleBackground"=>TRUE,"DrawSubTicks"=>TRUE,"GridR"=>0,"GridG"=>0,"GridB"=>0,"GridAlpha"=>10, "Mode"=>SCALE_MODE_ADDALL));

 /* Turn on shadow computing */
 $myPicture->setShadow(TRUE,array("X"=>1,"Y"=>1,"R"=>0,"G"=>0,"B"=>0,"Alpha"=>10));

 /* Draw some thresholds */
 $myPicture->setShadow(FALSE);
 $myPicture->drawThreshold(-40,array("WriteCaption"=>TRUE,"R"=>0,"G"=>0,"B"=>0,"Ticks"=>4));
 $myPicture->drawThreshold(28,array("WriteCaption"=>TRUE,"R"=>0,"G"=>0,"B"=>0,"Ticks"=>4));

 /* Draw the chart */
 $myPicture->drawStackedBarChart(array("Rounded"=>TRUE,"DisplayValues"=>TRUE,"DisplayColor"=>DISPLAY_AUTO,"DisplaySize"=>6,"BorderR"=>255, "BorderG"=>255,"BorderB"=>255));

 /* Write the chart legend */
 $myPicture->drawLegend(570,212,array("Style"=>LEGEND_NOBORDER,"Mode"=>LEGEND_HORIZONTAL));

 /* Render the picture (choose the best way) */
 $myPicture->autoOutput("pictures/example.drawStackedBarChart.rounded.png");
Third Sample script 
 include("class/pData.class.php");
 include("class/pDraw.class.php");
 include("class/pImage.class.php");

 $MyData = new pData();
 $MyData->addPoints(array(-4,VOID,VOID,12,8,3),"Frontend #1");
 $MyData->addPoints(array(3,12,15,8,5,-5),"Frontend #2");
 $MyData->addPoints(array(2,7,5,18,19,22),"Frontend #3");
 $MyData->setAxisName(0,"Average Usage");
 $MyData->addPoints(array("Jan","Feb","Mar","Apr","May","Jun"),"Labels");
 $MyData->setSerieDescription("Labels","Months");
 $MyData->setAbscissa("Labels");

 $MyData->normalize(100,"%");

 $myPicture = new pImage(700,230,$MyData);
 $myPicture->drawGradientArea(0,0,700,230,DIRECTION_VERTICAL,array("StartR"=>240,"StartG"=>240,"StartB"=>240,"EndR"=>180,"EndG"=>180,"EndB"=>180,"Alpha"=>100));
 $myPicture->drawGradientArea(0,0,700,230,DIRECTION_HORIZONTAL,array("StartR"=>240,"StartG"=>240,"StartB"=>240,"EndR"=>180,"EndG"=>180,"EndB"=>180,"Alpha"=>20));

 $myPicture->setFontProperties(array("FontName"=>"fonts/pf_arma_five.ttf","FontSize"=>6));

 $myPicture->setGraphArea(60,20,680,190);
 $myPicture->drawScale(array("DrawSubTicks"=>TRUE,"Mode"=>SCALE_MODE_ADDALL));
 $myPicture->setShadow(TRUE,array("X"=>1,"Y"=>1,"R"=>0,"G"=>0,"B"=>0,"Alpha"=>10));
 $myPicture->drawStackedBarChart(array("DisplayValues"=>TRUE,"DisplayColor"=>DISPLAY_AUTO,"Gradient"=>TRUE,"Surrounding"=>60));
 $myPicture->setShadow(FALSE);

 $myPicture->drawLegend(480,210,array("Style"=>LEGEND_NOBORDER,"Mode"=>LEGEND_HORIZONTAL));

 $myPicture->Render("drawStackedBarChart3.png");
Inner borders Sample script 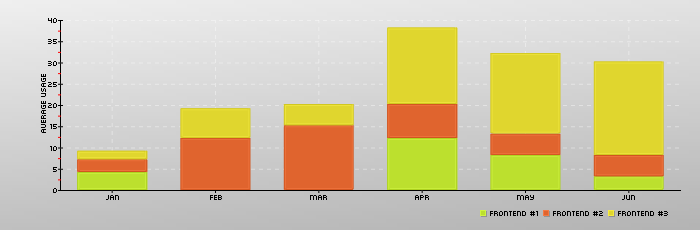
 /* pChart library inclusions */
 include("../class/pData.class.php");
 include("../class/pDraw.class.php");
 include("../class/pImage.class.php");

 /* Create and populate the pData object */
 $MyData = new pData();
 $MyData->addPoints(array(4,VOID,VOID,12,8,3),"Frontend #1");
 $MyData->addPoints(array(3,12,15,8,5,5),"Frontend #2");
 $MyData->addPoints(array(2,7,5,18,19,22),"Frontend #3");
 $MyData->setAxisName(0,"Average Usage");
 $MyData->addPoints(array("Jan","Feb","Mar","Apr","May","Jun"),"Labels");
 $MyData->setSerieDescription("Labels","Months");
 $MyData->setAbscissa("Labels");

 /* Create the pChart object */
 $myPicture = new pImage(700,230,$MyData);
 $myPicture->drawGradientArea(0,0,700,230,DIRECTION_VERTICAL,array("StartR"=>240,"StartG"=>240,"StartB"=>240,"EndR"=>180,"EndG"=>180,"EndB"=>180,"Alpha"=>100));
 $myPicture->drawGradientArea(0,0,700,230,DIRECTION_HORIZONTAL,array("StartR"=>240,"StartG"=>240,"StartB"=>240,"EndR"=>180,"EndG"=>180,"EndB"=>180,"Alpha"=>20));

 /* Set the default font properties */
 $myPicture->setFontProperties(array("FontName"=>"../fonts/pf_arma_five.ttf","FontSize"=>6));

 /* Draw the scale and the chart */
 $myPicture->setGraphArea(60,20,680,190);
 $myPicture->drawScale(array("DrawSubTicks"=>TRUE,"Mode"=>SCALE_MODE_ADDALL_START0));
 $myPicture->setShadow(FALSE);
 $myPicture->drawStackedBarChart(array("Surrounding"=>-15,"InnerSurrounding"=>15));

 /* Write the chart legend */
 $myPicture->drawLegend(480,210,array("Style"=>LEGEND_NOBORDER,"Mode"=>LEGEND_HORIZONTAL));

 /* Render the picture (choose the best way) */
 $myPicture->autoOutput("pictures/example.drawStackedBarChart.shaded.png");
© Copyrights
Components used on this web site : Famfamfam icons has been made by Mark James, Rounded corners lite has been coded by Cameron Cooke and Tim Hutchison, SyntaxHighlighter has
been written by Alex Gorbatchev. pChart and this web site have been created by Jean-Damien POGOLOTTI. This documentation contains 185 pages and 56 comments. 415 users have registered.
This page has been rendered in 0,02 seconds. Wiki revision 1.37.
|