|
Sample scripts » Combo charts
|
|
Latest updates
Toolbox
Google AdSense
|
Combo charts You may want to display your data series with different kind of charts using the same scale. This kind of data representation are called combo charts. To create one with pChart follow the following steps : Create all your datasets.
Draw the chart scale.
Draw the chart legend.
Hide the series desired.
Draw your 1st chart.
Hide the series desired.
Draw your 2nd chart.
... Using the setSerieDrawable() function you can easily activate / deactivate data series processing by all charting and drawing functions. You can re-use this scheme to draw as many different charts you want.
Sample script 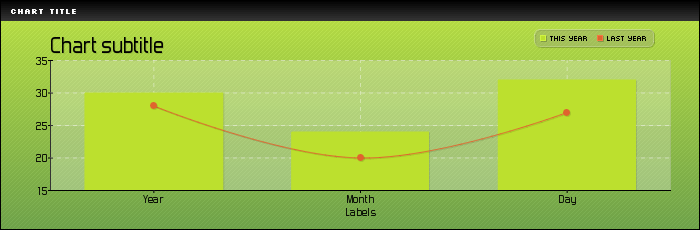
/* pChart library inclusions */
 include("../class/pData.class.php");
 include("../class/pDraw.class.php");
 include("../class/pImage.class.php");

 /* Create the pData object with some random values*/
 $MyData = new pData();
 $MyData->addPoints(array(30,24,32),"This year");
 $MyData->addPoints(array(28,20,27),"Last year");
 $MyData->addPoints(array("Year","Month","Day"),"Labels");
 $MyData->setAbscissa("Labels");

 /* Create the pChart object */
 $myPicture = new pImage(700,230,$MyData);

 /* Create a solid background */
 $Settings = array("R"=>179, "G"=>217, "B"=>91, "Dash"=>1, "DashR"=>199, "DashG"=>237, "DashB"=>111);
 $myPicture->drawFilledRectangle(0,0,700,230,$Settings);

 /* Do a gradient overlay */
 $Settings = array("StartR"=>194, "StartG"=>231, "StartB"=>44, "EndR"=>43, "EndG"=>107, "EndB"=>58, "Alpha"=>50);
 $myPicture->drawGradientArea(0,0,700,230,DIRECTION_VERTICAL,$Settings);
 $myPicture->drawGradientArea(0,0,700,20,DIRECTION_VERTICAL,array("StartR"=>0,"StartG"=>0,"StartB"=>0,"EndR"=>50,"EndG"=>50,"EndB"=>50,"Alpha"=>100));

 /* Add a border to the picture */
 $myPicture->drawRectangle(0,0,699,229,array("R"=>0,"G"=>0,"B"=>0));

 /* Write the picture title */
 $myPicture->setFontProperties(array("FontName"=>"../fonts/Silkscreen.ttf","FontSize"=>6));
 $myPicture->drawText(10,13,"Chart title",array("R"=>255,"G"=>255,"B"=>255));

 /* Draw the scale */
 $myPicture->setFontProperties(array("FontName"=>"../fonts/Forgotte.ttf","FontSize"=>11));
 $myPicture->setGraphArea(50,60,670,190);
 $myPicture->drawFilledRectangle(50,60,670,190,array("R"=>255,"G"=>255,"B"=>255,"Surrounding"=>-200,"Alpha"=>10));
 $myPicture->drawScale(array("CycleBackground"=>TRUE));

 /* Graph title */
 $myPicture->setShadow(TRUE,array("X"=>1,"Y"=>1,"R"=>0,"G"=>0,"B"=>0,"Alpha"=>10));
 $myPicture->drawText(50,52,"Chart subtitle",array("FontSize"=>20,"Align"=>TEXT_ALIGN_BOTTOMLEFT));

 /* Draw the bar chart chart */
 $myPicture->setFontProperties(array("FontName"=>"../fonts/pf_arma_five.ttf","FontSize"=>6));
 $MyData->setSerieDrawable("Last year",FALSE);
 $myPicture->drawBarChart();

 /* Draw the line and plot chart */
 $MyData->setSerieDrawable("Last year",TRUE);
 $MyData->setSerieDrawable("This year",FALSE);
 $myPicture->drawSplineChart();
 $myPicture->drawPlotChart();

 /* Make sure all series are drawable before writing the scale */
 $MyData->setSerieDrawable("This year",TRUE);

 /* Write the legend */
 $myPicture->drawLegend(540,35,array("Style"=>LEGEND_ROUND,"Alpha"=>20,"Mode"=>LEGEND_HORIZONTAL));

 /* Render the picture (choose the best way) */
 $myPicture->autoOutput("pictures/example.combo.png");
© Copyrights
Components used on this web site : Famfamfam icons has been made by Mark James, Rounded corners lite has been coded by Cameron Cooke and Tim Hutchison, SyntaxHighlighter has
been written by Alex Gorbatchev. pChart and this web site have been created by Jean-Damien POGOLOTTI. This documentation contains 185 pages and 56 comments. 415 users have registered.
This page has been rendered in 0,01 seconds. Wiki revision 1.37.
|