|
Language Reference » Pie charts class » Pie basics
|
|
Latest updates
Toolbox
Google AdSense
|
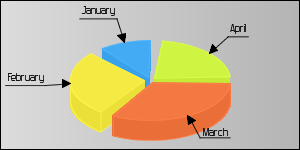
Pie charts basics pChart can render both 2D and 3D pie charts. Data are provided through the pData class with some limitation because only one data serie may be rendered on this kind of charts. Only the 1st data serie that is marked as Drawable will be used.
An abscissa serie must be set, it will be used for labelling the data. Exemple Let‘s assume that we got the data represented in the table bellow :  This will lead to the following declaration with the pData object structure :
 /* pData object creation */
 $MyData = new pData();

 /* Data definition */
 $MyData->addPoints(array(20,30,25,10),"Value");

 /* Labels definition */
 $MyData->addPoints(array("January","February","March","April"),"Legend");
 $MyData->setAbscissa("Legend");
 Full example code
 /* pChart library inclusions */
 include("../class/pData.class.php");
 include("../class/pDraw.class.php");
 include("../class/pPie.class.php");
 include("../class/pImage.class.php");

 /* pData object creation */
 $MyData = new pData();

 /* Data definition */
 $MyData->addPoints(array(20,30,25,10),"Value");

 /* Labels definition */
 $MyData->addPoints(array("January","February","March","April"),"Legend");
 $MyData->setAbscissa("Legend");

 /* Create the pChart object */
 $myPicture = new pImage(300,150,$MyData);

 /* Draw a gradient background */
 $myPicture->drawGradientArea(0,0,300,300,DIRECTION_HORIZONTAL,array("StartR"=>220,"StartG"=>220,"StartB"=>220,"EndR"=>180,"EndG"=>180,"EndB"=>180,"Alpha"=>100));

 /* Add a border to the picture */
 $myPicture->drawRectangle(0,0,299,149,array("R"=>0,"G"=>0,"B"=>0));

 /* Create the pPie object */
 $PieChart = new pPie($myPicture,$MyData);

 /* Enable shadow computing */
 $myPicture->setShadow(FALSE);

 /* Set the default font properties */
 $myPicture->setFontProperties(array("FontName"=>"../fonts/Forgotte.ttf","FontSize"=>10,"R"=>80,"G"=>80,"B"=>80));

 /* Draw a splitted pie chart */
 $PieChart->draw3DPie(150,100,array("Radius"=>80,"DrawLabels"=>TRUE,"DataGapAngle"=>10,"DataGapRadius"=>6,"Border"=>TRUE));

 /* Render the picture (choose the best way) */
 $myPicture->autoOutput("pie.png");
© Copyrights
Components used on this web site : Famfamfam icons has been made by Mark James, Rounded corners lite has been coded by Cameron Cooke and Tim Hutchison, SyntaxHighlighter has
been written by Alex Gorbatchev. pChart and this web site have been created by Jean-Damien POGOLOTTI. This documentation contains 185 pages and 56 comments. 415 users have registered.
This page has been rendered in 0,01 seconds. Wiki revision 1.37.
|