|
Sample scripts » Drawing objets
|
|
Latest updates
Toolbox
Google AdSense
|
Drawing object - An introduction to this library pChart is providing many "basic" drawing function that will allow you to enhance the rendering of your images. All the internal drawing functions are using the anti-aliasing algorithm to provide the best ‘look-n-feel‘ experience for your users. Sample script The sample below will show you the way to create rich & nice looking charts background starting from scratch with a blank area. By going through this documentation you‘ll see that the pChart library provide a number of functions to add rich contents to your outputs. Rendering quality has always been the key axis of improvements. 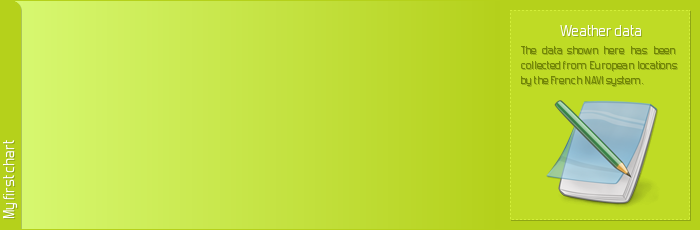
 /* pChart library inclusions */
 include("class/pDraw.class.php");
 include("class/pImage.class.php");

 /* Create the pChart object */
 $myPicture = new pImage(700,230);

 /* Define default font settings */
 $myPicture->setFontProperties(array("FontName"=>"fonts/Forgotte.ttf","FontSize"=>14));

 /* Create the background */
 $myPicture->drawGradientArea(0,0,500,230,DIRECTION_HORIZONTAL,array("StartR"=>217,"StartG"=>250,"StartB"=>116,"EndR"=>181,"EndG"=>209,"EndB"=>27,"Alpha"=>100));
 $RectangleSettings = array("R"=>181,"G"=>209,"B"=>27,"Alpha"=>100);
 $myPicture->drawFilledRectangle(500,0,700,230,$RectangleSettings);

 /* Enable shadow computing on a (+1,+1) basis */
 $myPicture->setShadow(TRUE,array("X"=>1,"Y"=>1,"R"=>0,"G"=>0,"B"=>0,"Alpha"=>20));

 /* Draw the left area */
 $RectangleSettings = array("R"=>181,"G"=>209,"B"=>27,"Alpha"=>100);
 $myPicture->drawRoundedFilledRectangle(-5,0,20,240,10,$RectangleSettings);
 $TextSettings = array("R"=>255,"G"=>255,"B"=>255,"Angle"=>90,"Align"=>TEXT_ALIGN_MIDDLELEFT);
 $myPicture->drawText(10,220,"My first chart",$TextSettings);

 /* Draw the right area */
 $RectangleSettings = array("R"=>191,"G"=>219,"B"=>37,"Alpha"=>100,"Surrounding"=>20,"Ticks"=>2);
 $myPicture->drawFilledRectangle(510,10,689,219,$RectangleSettings);

 /* Write the legend */
 $TextSettings = array("R"=>255,"G"=>255,"B"=>255,"Align"=>TEXT_ALIGN_MIDDLEMIDDLE);
 $myPicture->drawText(600,30,"Weather data",$TextSettings);
 $TextSettings = array("R"=>106,"G"=>125,"B"=>3,"Align"=>TEXT_ALIGN_TOPLEFT,"FontSize"=>11);
 $myPicture->drawText(520,45,"The   data  shown  here   has   been",$TextSettings);
 $myPicture->drawText(520,60,"collected from European locations",$TextSettings);
 $myPicture->drawText(520,75,"by the French NAVI system.",$TextSettings);
 $myPicture->drawFromPNG(540,90,"resources/blocnote.png");

 /* Disable shadow computing  */
 $myPicture->setShadow(FALSE);

 /* Draw the picture border */
 $RectangleSettings = array("R"=>181,"G"=>209,"B"=>27,"Alpha"=>100);
 $myPicture->drawRectangle(0,0,699,229,$RectangleSettings);

 /* Render the picture */
 $myPicture->Render("drawobjects.png");
© Copyrights
Components used on this web site : Famfamfam icons has been made by Mark James, Rounded corners lite has been coded by Cameron Cooke and Tim Hutchison, SyntaxHighlighter has
been written by Alex Gorbatchev. pChart and this web site have been created by Jean-Damien POGOLOTTI. This documentation contains 185 pages and 56 comments. 415 users have registered.
This page has been rendered in 0,01 seconds. Wiki revision 1.37.
|