|
Language Reference » Charting functions » drawBestFit
|
|
Latest updates
Toolbox
Google AdSense
|
drawBestFit - Draw the "line of best fit" This function allows you to draw the line of best fit associated with your given data series. All the drawing parameters are given trough a $Format array. To learn more about this please read the Format array guide. The mathematical formula used to compute it is described below :  Calling this function
drawBestFit($Format="");Where : Format is an array containing the drawing parameters of the chart. (today none are defined) Customisation array - Tune up your chart! It is possible to customize the rendering by playing with this array. Providing a detailled configuration is not mandatory. You‘ll see below a representation of all the customization possible : You can optionally specify the line ticks width with Ticks. Sample script 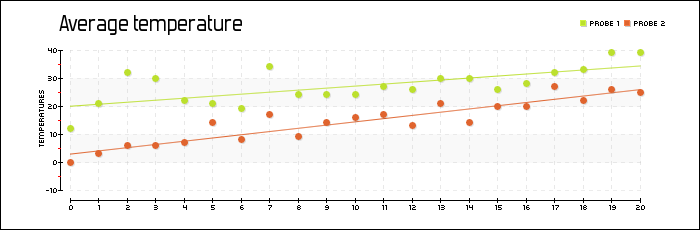
 /* pChart library inclusions */
 include("../class/pData.class.php");
 include("../class/pDraw.class.php");
 include("../class/pImage.class.php");

 /* Create and populate the pData object */
 $MyData = new pData();
 for($i=0;$i<=20;$i++) { $MyData->addPoints(rand(10,30)+$i,"Probe 1"); }
 for($i=0;$i<=20;$i++) { $MyData->addPoints(rand(0,10)+$i,"Probe 2"); }
 $MyData->setAxisName(0,"Temperatures");

 /* Create the pChart object */
 $myPicture = new pImage(700,230,$MyData);

 /* Turn of Antialiasing */
 $myPicture->Antialias = FALSE;

 /* Add a border to the picture */
 $myPicture->drawRectangle(0,0,699,229,array("R"=>0,"G"=>0,"B"=>0));

 /* Write the chart title */
 $myPicture->setFontProperties(array("FontName"=>"../fonts/Forgotte.ttf","FontSize"=>11));
 $myPicture->drawText(150,35,"Average temperature",array("FontSize"=>20,"Align"=>TEXT_ALIGN_BOTTOMMIDDLE));

 /* Set the default font */
 $myPicture->setFontProperties(array("FontName"=>"../fonts/pf_arma_five.ttf","FontSize"=>6));

 /* Define the chart area */
 $myPicture->setGraphArea(60,40,650,200);

 /* Draw the scale */
 $scaleSettings = array("XMargin"=>10,"YMargin"=>10, "Floating"=>TRUE,"GridR"=>200, "GridG"=>200,"GridB"=>200,"DrawSubTicks"=>TRUE, "CycleBackground"=>TRUE);
 $myPicture->drawScale($scaleSettings);

 /* Turn on Antialiasing */
 $myPicture->Antialias = TRUE;

 /* Draw the line of best fit */
 $myPicture->drawBestFit();

 /* Turn on shadows */
 $myPicture->setShadow(TRUE,array("X"=>1,"Y"=>1,"R"=>0,"G"=>0,"B"=>0,"Alpha"=>10));

 /* Draw the line chart */
 $myPicture->drawPlotChart();

 /* Write the chart legend */
 $myPicture->drawLegend(580,20,array("Style"=>LEGEND_NOBORDER,"Mode"=>LEGEND_HORIZONTAL));

 /* Render the picture (choose the best way) */
 $myPicture->autoOutput("pictures/example.drawBestFit.png");
© Copyrights
Components used on this web site : Famfamfam icons has been made by Mark James, Rounded corners lite has been coded by Cameron Cooke and Tim Hutchison, SyntaxHighlighter has
been written by Alex Gorbatchev. pChart and this web site have been created by Jean-Damien POGOLOTTI. This documentation contains 185 pages and 56 comments. 415 users have registered.
This page has been rendered in 0,01 seconds. Wiki revision 1.37.
|