|
Language Reference » Drawing functions » writeLabel
|
|
Latest updates
Toolbox
Google AdSense
|
writeLabel - Create labels This function allows you to write nice looking labels over your charts. All the drawing parameters are given trough a $Format array. To learn more about this please read the Format array guide. Calling this function
writeLabel($SeriesName,$Indexes,$Format="");Where : SeriesName is an array containing the name of the series were the labels applies.
Indexes is an array containing the position of the points were a label should be written
Format is an array containing the drawing parameters of the arrow. Customisation array - Tune up your label! It is possible to customize the rendering by playing with this array. Providing a detailled configuration is not mandatory. You can remove the label title setting NoTitle to TRUE.
You can force the label(s) title with OverrideTitle.
You can force the label(s) values(s) specifying each displayed values in the array ForceLabels.
You can draw a box marker over the data point setting DrawPoint to TRUE.
You can draw a vertical line over the data point setting DrawVerticalLine to TRUE.
You can specify the vertical line color with VerticalLineR,VerticalLineG,VerticalLineB,VerticalLineAlpha.
You can specify the vertical line ticks width with VerticalLineTicks.
You can specify the minimum label width with BoxWidth.
You can specify if you want to draw the serie color box setting DrawSerieColor to TRUE.
You can specify the size of the serie box with SerieBoxSize.
You can specify the vertical margin with VerticalMargin.
You can specify the horizontal margin with HorizontalMargin.
You can specify the name of the font to use with B]FontName.
You can specify the size of the font to use with B]FontSize.
You can specify the title color with TitleR,TitleG,TitleB.
You can specify the title background color with TitleBackgroundR,TitleBackgroundG,TitleBackgroundB.
You can specify the box gradient starting color with GradientStartR,GradientStartG,GradientStartB.
You can specify the box gradient ending color with GradientEndR,GradientEndG,GradientEndB. You can choose if the title will got a solid background with TitleMode : LABEL_TITLE_NOBACKGROUND no background.
LABEL_TITLE_BACKGROUND solid background. Sample script #1 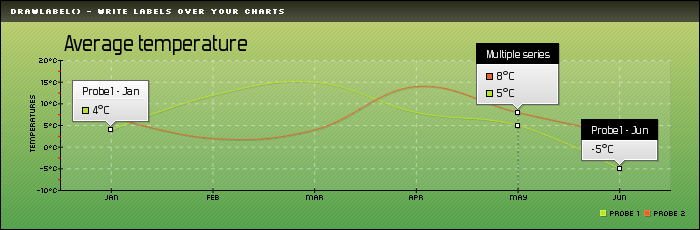
 /* pChart library inclusions */
 include("../class/pData.class.php");
 include("../class/pDraw.class.php");
 include("../class/pImage.class.php");

 /* Create and populate the pData object */
 $MyData = new pData();
 $MyData->addPoints(array(4,12,15,8,5,-5),"Probe 1");
 $MyData->addPoints(array(7,2,4,14,8,3),"Probe 2");
 $MyData->setAxisName(0,"Temperatures");
 $MyData->setAxisUnit(0,"°C");
 $MyData->addPoints(array("Jan","Feb","Mar","Apr","May","Jun"),"Labels");
 $MyData->setSerieDescription("Labels","Months");
 $MyData->setAbscissa("Labels");

 /* Create the pChart object */
 $myPicture = new pImage(700,230,$MyData);

 /* Draw the background */
 $Settings = array("R"=>170, "G"=>183, "B"=>87, "Dash"=>1, "DashR"=>190, "DashG"=>203, "DashB"=>107);
 $myPicture->drawFilledRectangle(0,0,700,230,$Settings);

 /* Overlay with a gradient */
 $Settings = array("StartR"=>219, "StartG"=>231, "StartB"=>139, "EndR"=>1, "EndG"=>138, "EndB"=>68, "Alpha"=>50);
 $myPicture->drawGradientArea(0,0,700,230,DIRECTION_VERTICAL,$Settings);
 $myPicture->drawGradientArea(0,0,700,20,DIRECTION_VERTICAL,array("StartR"=>0,"StartG"=>0,"StartB"=>0,"EndR"=>50,"EndG"=>50,"EndB"=>50,"Alpha"=>80));

 /* Add a border to the picture */
 $myPicture->drawRectangle(0,0,699,229,array("R"=>0,"G"=>0,"B"=>0));

 /* Write the picture title */
 $myPicture->setFontProperties(array("FontName"=>"../fonts/Silkscreen.ttf","FontSize"=>6));
 $myPicture->drawText(10,13,"drawLabel() - Write labels over your charts",array("R"=>255,"G"=>255,"B"=>255));

 /* Write the chart title */
 $myPicture->setFontProperties(array("FontName"=>"../fonts/Forgotte.ttf","FontSize"=>11));
 $myPicture->drawText(155,55,"Average temperature",array("FontSize"=>20,"Align"=>TEXT_ALIGN_BOTTOMMIDDLE));

 /* Draw the scale and the 1st chart */
 $myPicture->setGraphArea(60,60,670,190);
 $myPicture->drawFilledRectangle(60,60,670,190,array("R"=>255,"G"=>255,"B"=>255,"Surrounding"=>-200,"Alpha"=>10));
 $myPicture->setFontProperties(array("FontName"=>"../fonts/pf_arma_five.ttf","FontSize"=>6));
 $myPicture->drawScale(array("DrawSubTicks"=>TRUE));
 $myPicture->setShadow(TRUE,array("X"=>1,"Y"=>1,"R"=>0,"G"=>0,"B"=>0,"Alpha"=>10));
 $myPicture->drawSplineChart();
 $myPicture->setShadow(FALSE);

 /* Write the chart legend */
 $myPicture->drawLegend(600,210,array("Style"=>LEGEND_NOBORDER,"Mode"=>LEGEND_HORIZONTAL));

 $myPicture->setShadow(TRUE,array("X"=>1,"Y"=>1,"R"=>0,"G"=>0,"B"=>0,"Alpha"=>10));
 $myPicture->setFontProperties(array("FontName"=>"../fonts/Forgotte.ttf","FontSize"=>11));

 /* Write a label over the chart */
 $myPicture->writeLabel("Probe 1",0);

 /* Write a label over the chart */
 $LabelSettings = array("TitleMode"=>LABEL_TITLE_BACKGROUND,"DrawSerieColor"=>FALSE,"TitleR"=>255,"TitleG"=>255,"TitleB"=>255);
 $myPicture->writeLabel("Probe 1",5,$LabelSettings);

 /* Write a label over the chart */
 $LabelSettings = array("OverrideTitle"=>"Multiple series","DrawVerticalLine"=>TRUE,"TitleMode"=>LABEL_TITLE_BACKGROUND,"TitleR"=>255,"TitleG"=>255,"TitleB"=>255);
 $myPicture->writeLabel(array("Probe 1","Probe 2"),4,$LabelSettings);

 /* Render the picture (choose the best way) */
 $myPicture->autoOutput("pictures/example.drawLabel.png");
Sample script #2 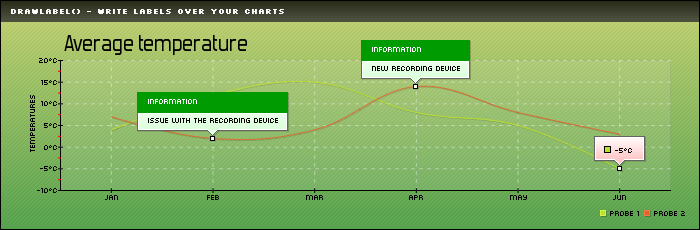
 /* pChart library inclusions */
 include("../class/pData.class.php");
 include("../class/pDraw.class.php");
 include("../class/pImage.class.php");

 /* Create and populate the pData object */
 $MyData = new pData();
 $MyData->addPoints(array(4,12,15,8,5,-5),"Probe 1");
 $MyData->addPoints(array(7,2,4,14,8,3),"Probe 2");
 $MyData->setAxisName(0,"Temperatures");
 $MyData->setAxisUnit(0,"°C");
 $MyData->addPoints(array("Jan","Feb","Mar","Apr","May","Jun"),"Labels");
 $MyData->setSerieDescription("Labels","Months");
 $MyData->setAbscissa("Labels");

 /* Create the pChart object */
 $myPicture = new pImage(700,230,$MyData);

 /* Draw the background */
 $Settings = array("R"=>170, "G"=>183, "B"=>87, "Dash"=>1, "DashR"=>190, "DashG"=>203, "DashB"=>107);
 $myPicture->drawFilledRectangle(0,0,700,230,$Settings);

 /* Overlay with a gradient */
 $Settings = array("StartR"=>219, "StartG"=>231, "StartB"=>139, "EndR"=>1, "EndG"=>138, "EndB"=>68, "Alpha"=>50);
 $myPicture->drawGradientArea(0,0,700,230,DIRECTION_VERTICAL,$Settings);
 $myPicture->drawGradientArea(0,0,700,20,DIRECTION_VERTICAL,array("StartR"=>0,"StartG"=>0,"StartB"=>0,"EndR"=>50,"EndG"=>50,"EndB"=>50,"Alpha"=>80));

 /* Add a border to the picture */
 $myPicture->drawRectangle(0,0,699,229,array("R"=>0,"G"=>0,"B"=>0));

 /* Write the picture title */
 $myPicture->setFontProperties(array("FontName"=>"../fonts/Silkscreen.ttf","FontSize"=>6));
 $myPicture->drawText(10,13,"drawLabel() - Write labels over your charts",array("R"=>255,"G"=>255,"B"=>255));

 /* Write the chart title */
 $myPicture->setFontProperties(array("FontName"=>"../fonts/Forgotte.ttf","FontSize"=>11));
 $myPicture->drawText(155,55,"Average temperature",array("FontSize"=>20,"Align"=>TEXT_ALIGN_BOTTOMMIDDLE));

 /* Draw the scale and the 1st chart */
 $myPicture->setGraphArea(60,60,670,190);
 $myPicture->drawFilledRectangle(60,60,670,190,array("R"=>255,"G"=>255,"B"=>255,"Surrounding"=>-200,"Alpha"=>10));
 $myPicture->setFontProperties(array("FontName"=>"../fonts/pf_arma_five.ttf","FontSize"=>6));
 $myPicture->drawScale(array("DrawSubTicks"=>TRUE));
 $myPicture->setShadow(TRUE,array("X"=>1,"Y"=>1,"R"=>0,"G"=>0,"B"=>0,"Alpha"=>10));
 $myPicture->drawSplineChart();
 $myPicture->setShadow(FALSE);

 /* Write the chart legend */
 $myPicture->drawLegend(600,210,array("Style"=>LEGEND_NOBORDER,"Mode"=>LEGEND_HORIZONTAL));

 $myPicture->setShadow(TRUE,array("X"=>1,"Y"=>1,"R"=>0,"G"=>0,"B"=>0,"Alpha"=>10));
 $myPicture->setFontProperties(array("FontName"=>"../fonts/pf_arma_five.ttf","FontSize"=>6));

 /* Write a label over the chart */
 $LabelSettings = array("TitleR"=>255,"TitleG"=>255,"TitleB"=>255, "DrawSerieColor"=>FALSE,"TitleMode"=>LABEL_TITLE_BACKGROUND, "OverrideTitle"=>"Information","ForceLabels"=>array("Issue with the recording device","New recording device"), "GradientEndR"=>220,"GradientEndG"=>255,"GradientEndB"=>220, "TitleBackgroundG"=>155);
 $myPicture->writeLabel(array("Probe 2"),array(1,3),$LabelSettings);

 /* Write a label over the chart */
 $LabelSettings = array("NoTitle"=>TRUE,"GradientEndR"=>255,"GradientEndG"=>200,"GradientEndB"=>200);
 $myPicture->writeLabel(array("Probe 1"),5,$LabelSettings);

 /* Render the picture (choose the best way) */
 $myPicture->autoOutput("pictures/example.drawLabel.caption.png");
Sample script #2 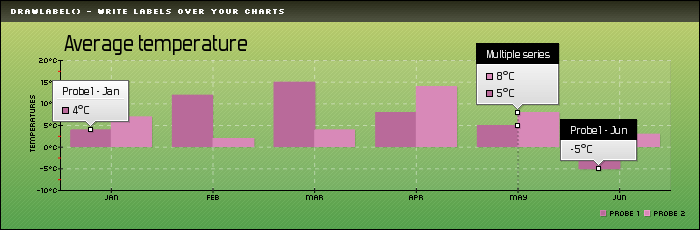
 /* pChart library inclusions */
 include("../class/pData.class.php");
 include("../class/pDraw.class.php");
 include("../class/pImage.class.php");

 /* Create and populate the pData object */
 $MyData = new pData();
 $MyData->loadPalette("../palettes/autumn.color",TRUE);
 $MyData->addPoints(array(4,12,15,8,5,-5),"Probe 1");
 $MyData->addPoints(array(7,2,4,14,8,3),"Probe 2");
 $MyData->setAxisName(0,"Temperatures");
 $MyData->setAxisUnit(0,"°C");
 $MyData->addPoints(array("Jan","Feb","Mar","Apr","May","Jun"),"Labels");
 $MyData->setSerieDescription("Labels","Months");
 $MyData->setAbscissa("Labels");

 /* Create the pChart object */
 $myPicture = new pImage(700,230,$MyData);

 /* Draw the background */
 $Settings = array("R"=>170, "G"=>183, "B"=>87, "Dash"=>1, "DashR"=>190, "DashG"=>203, "DashB"=>107);
 $myPicture->drawFilledRectangle(0,0,700,230,$Settings);

 /* Overlay with a gradient */
 $Settings = array("StartR"=>219, "StartG"=>231, "StartB"=>139, "EndR"=>1, "EndG"=>138, "EndB"=>68, "Alpha"=>50);
 $myPicture->drawGradientArea(0,0,700,230,DIRECTION_VERTICAL,$Settings);
 $myPicture->drawGradientArea(0,0,700,20,DIRECTION_VERTICAL,array("StartR"=>0,"StartG"=>0,"StartB"=>0,"EndR"=>50,"EndG"=>50,"EndB"=>50,"Alpha"=>80));

 /* Add a border to the picture */
 $myPicture->drawRectangle(0,0,699,229,array("R"=>0,"G"=>0,"B"=>0));

 /* Write the picture title */
 $myPicture->setFontProperties(array("FontName"=>"../fonts/Silkscreen.ttf","FontSize"=>6));
 $myPicture->drawText(10,13,"drawLabel() - Write labels over your charts",array("R"=>255,"G"=>255,"B"=>255));

 /* Write the chart title */
 $myPicture->setFontProperties(array("FontName"=>"../fonts/Forgotte.ttf","FontSize"=>11));
 $myPicture->drawText(155,55,"Average temperature",array("FontSize"=>20,"Align"=>TEXT_ALIGN_BOTTOMMIDDLE));

 /* Draw the scale and the 1st chart */
 $myPicture->setGraphArea(60,60,670,190);
 $myPicture->drawFilledRectangle(60,60,670,190,array("R"=>255,"G"=>255,"B"=>255,"Surrounding"=>-200,"Alpha"=>10));
 $myPicture->setFontProperties(array("FontName"=>"../fonts/pf_arma_five.ttf","FontSize"=>6));
 $myPicture->drawScale(array("DrawSubTicks"=>TRUE));
 $myPicture->setShadow(TRUE,array("X"=>1,"Y"=>1,"R"=>0,"G"=>0,"B"=>0,"Alpha"=>10));
 $myPicture->drawBarChart();
 $myPicture->setShadow(FALSE);

 /* Write the chart legend */
 $myPicture->drawLegend(600,210,array("Style"=>LEGEND_NOBORDER,"Mode"=>LEGEND_HORIZONTAL));

 $myPicture->setShadow(TRUE,array("X"=>1,"Y"=>1,"R"=>0,"G"=>0,"B"=>0,"Alpha"=>10));
 $myPicture->setFontProperties(array("FontName"=>"../fonts/Forgotte.ttf","FontSize"=>11));

 /* Write a label over the chart */
 $myPicture->writeLabel("Probe 1",0);

 /* Write a label over the chart */
 $LabelSettings = array("TitleMode"=>LABEL_TITLE_BACKGROUND,"DrawSerieColor"=>FALSE,"TitleR"=>255,"TitleG"=>255,"TitleB"=>255);
 $myPicture->writeLabel("Probe 1",5,$LabelSettings);

 /* Write a label over the chart */
 $LabelSettings = array("OverrideTitle"=>"Multiple series","DrawVerticalLine"=>TRUE,"TitleMode"=>LABEL_TITLE_BACKGROUND, "TitleR"=>255,"TitleG"=>255,"TitleB"=>255);
 $myPicture->writeLabel(array("Probe 1","Probe 2"),4,$LabelSettings);

 /* Render the picture (choose the best way) */
 $myPicture->autoOutput("pictures/example.drawLabel.png");
© Copyrights
Components used on this web site : Famfamfam icons has been made by Mark James, Rounded corners lite has been coded by Cameron Cooke and Tim Hutchison, SyntaxHighlighter has
been written by Alex Gorbatchev. pChart and this web site have been created by Jean-Damien POGOLOTTI. This documentation contains 185 pages and 56 comments. 415 users have registered.
This page has been rendered in 0,02 seconds. Wiki revision 1.37.
|