|
Language Reference » Radar & Polar charts » drawRadar
|
|
Latest updates
Toolbox
Google AdSense
|
drawRadar - Draw radar charts This function allows you to draw a radar chart. All the drawing parameters are given trough a $Format array. To learn more about this please read the Format array guide. Radar charts have been completly relooked since pChart 1.x to take full advantage of the new anti-aliasing, transparency & shadow engine. Best is to keep the scale computing to automatic (SEGMENT_HEIGHT_AUTO) to have the most eye candy rendering. Calling this function
drawRadar($Object,$Values,$Format);Where : Object is reference to a pImage object.
Values is reference to a pData object.
Format is an array containing the drawing parameters of the chart. Customisation array - Tune up your chart! It is possible to customize the radar chart rendering by playing with this array. Providing a detailled configuration is not mandatory. You‘ll see below a representation of all the customization possible : You can specify if the axis color with AxisR, AxisG, AxisB, AxisAlpha.
You can fix the maximum value of the branches with FixedMax even if never reached.
You can specify the axis rotation in degree using AxisRotation.
You can draw ticks outside of the radard setting DrawTicks to TRUE.
You can define the ticks length with TicksLength (default is 2px)
You can write the axis names setting DrawAxisValues to TRUE.
You can write the axis names in a rounded box setting AxisBoxRounded to TRUE.
You can choose the axis font settings with AxisFontName and AxisFontSize.
You can write the points values setting WriteValues to TRUE.
You can write the values in a bubble setting WriteValuesInBubble to TRUE.
You can choose the values font settings with ValueFontName and ValueFontSize.
You can specify an extra padding for the values with ValuePadding.
You can tune the outter bubble visual parameters with OuterBubbleRadius,OuterBubbleR,OuterBubbleG,OuterBubbleB,OuterBubbleAlpha.
You can tune the inner bubble visual parameters with InnerBubbleR,InnerBubbleG,InnerBubbleB,InnerBubbleAlpha.
You can specify the position of the axis names with LabelPos (see below).
You can specify the label paddings with LabelPadding (default is 4px).
You can draw a background setting DrawBackground to TRUE.
You can specify the background color with BackgroundR, BackgroundG, BackgroundB, BackgroundAlpha.
You can specify a background gradient with BackgroundGradient see the details below .
You can define the radar layout with Layout see the details below .
You can specify the height of one segment manually with SegmentHeight (default is SEGMENT_HEIGHT_AUTO for automatic computation)
You can specify the number of segments manually with Segments (this may be overwritten if you use SEGMENT_HEIGHT_AUTO)
You can write the segments values setting WriteLabels to TRUE.
You can skip any number of labels playing with SkipLabels.
You can center the label in the slice setting LabelMiddle to TRUE.
You can specify if the segment values should have background setting LabelsBackground to TRUE.
You can specify the segments values background color with LabelsBGR, LabelsBGG, LabelsBGB, LabelsBGAlpha.
You can specify if you want to draw a circle for each data point setting DrawPoints to TRUE.
You can specify the radius of the circles with PointRadius. (default is 4)
You can specify a surrounding color around the circles with PointSurrounding. (default is -30)
You can specify if you want to draw lines between each data point setting DrawLines to TRUE.
You define if lines should loop to the 1st data point setting LineLoopStart to TRUE.
You can specify if you want to draw polygons with your data points setting DrawPoly to TRUE.
You can overide the polygons transparency with PolyAlpha. The Layout (Layout) can be : RADAR_LAYOUT_STAR, this will draw star like axis.
RADAR_LAYOUT_CIRCLE, this will draw concentric circles axis. The labels positions (LabelPos) can be : RADAR_LABELS_ROTATED, this will written with an angle depending of the axis position.
RADAR_LABELS_HORIZONTAL, labels will be written horizontally. Gradients are defined with an array containing 8 values : The starting color defined by StartR, StartG, StartB, StartAlpha.
The ending color defined by EndR, EndG, EndB, EndAlpha.
$Gradient = array("StartR"=>255,"StartG"=>255,"StartB"=>255,"StartAlpha"=>50,"EndR"=>32,"EndG"=>109,"EndB"=>174,"EndAlpha"=>30)
Sample script 
  /* pChart library inclusions */
 include("class/pData.class.php");
 include("class/pDraw.class.php");
 include("class/pRadar.class.php");
 include("class/pImage.class.php");

 /* Prepare some nice data & axis config */
 $MyData = new pData();
 $MyData->addPoints(array(40,20,15,10,8,4),"ScoreA");
 $MyData->addPoints(array(8,10,12,20,30,15),"ScoreB");
 $MyData->setSerieDescription("ScoreA","Application A");
 $MyData->setSerieDescription("ScoreB","Application B");

 /* Create the X serie */
 $MyData->addPoints(array("Size","Speed","Reliability","Functionalities","Ease of use","Weight"),"Labels");
 $MyData->setAbscissa("Labels");

 /* Create the pChart object */
 $myPicture = new pImage(700,230,$MyData);

 /* Draw a solid background */
 $Settings = array("R"=>179, "G"=>217, "B"=>91, "Dash"=>1, "DashR"=>199, "DashG"=>237, "DashB"=>111);
 $myPicture->drawFilledRectangle(0,0,700,230,$Settings);

 /* Overlay some gradient areas */
 $Settings = array("StartR"=>194, "StartG"=>231, "StartB"=>44, "EndR"=>43, "EndG"=>107, "EndB"=>58, "Alpha"=>50);
 $myPicture->drawGradientArea(0,0,700,230,DIRECTION_VERTICAL,$Settings);
 $myPicture->drawGradientArea(0,0,700,20,DIRECTION_VERTICAL,array("StartR"=>0,"StartG"=>0,"StartB"=>0,"EndR"=>50,"EndG"=>50,"EndB"=>50,"Alpha"=>100));

 /* Draw the border */
 $myPicture->drawRectangle(0,0,699,229,array("R"=>0,"G"=>0,"B"=>0));

 /* Write the title */
 $myPicture->setFontProperties(array("FontName"=>"fonts/Silkscreen.ttf","FontSize"=>6));
 $myPicture->drawText(10,13,"pRadar - Draw radar charts",array("R"=>255,"G"=>255,"B"=>255));

 /* Define general drawing parameters */
 $myPicture->setFontProperties(array("FontName"=>"fonts/Forgotte.ttf","FontSize"=>10,"R"=>80,"G"=>80,"B"=>80));
 $myPicture->setShadow(TRUE,array("X"=>2,"Y"=>2,"R"=>0,"G"=>0,"B"=>0,"Alpha"=>10));

 /* Create the radar object */
 $SplitChart = new pRadar();

 /* Draw the 1st radar chart */
 $myPicture->setGraphArea(10,25,340,225);
 $Options = array("Layout"=>RADAR_LAYOUT_STAR,"BackgroundGradient"=>array("StartR"=>255,"StartG"=>255,"StartB"=>255,"StartAlpha"=>100,"EndR"=>207,"EndG"=>227,"EndB"=>125,"EndAlpha"=>50));
 $SplitChart->drawRadar($myPicture,$MyData,$Options);

 /* Draw the 2nd radar chart */
 $myPicture->setGraphArea(350,25,690,225);
 $Options = array("Layout"=>RADAR_LAYOUT_CIRCLE, "LabelPos"=>RADAR_LABELS_HORIZONTAL, "BackgroundGradient"=>array("StartR"=>255,"StartG"=>255,"StartB"=>255,"StartAlpha"=>50,"EndR"=>32,"EndG"=>109,"EndB"=>174,"EndAlpha"=>30));
 $SplitChart->drawRadar($myPicture,$MyData,$Options);

 /* Write down the legend */
 $myPicture->setFontProperties(array("FontName"=>"fonts/pf_arma_five.ttf","FontSize"=>6));
 $myPicture->drawLegend(270,205,array("Style"=>LEGEND_BOX,"Mode"=>LEGEND_HORIZONTAL));

 /* Render the picture */
 $myPicture->Render("drawradar.png");
Sample script - Playing with labels In this example we only print one label every 3 divisions (using the SkipLabels parameter). We‘ve also choosen to center the label inside each main slice parts (setting LabelMiddle to TRUE). 
 /* pChart library inclusions */
 include("../class/pData.class.php");
 include("../class/pDraw.class.php");
 include("../class/pRadar.class.php");
 include("../class/pImage.class.php");

 /* Create and populate the pData object */
 $MyData = new pData();
 $MyData->addPoints(array(2,2,10,10,4,4,15,15,2,2,10,10,4,4,15,15,2,2,10,10,4,4,15,15),"ScoreA");
 $MyData->setSerieDescription("ScoreA","Application A");
 $MyData->setPalette("ScoreA",array("R"=>150,"G"=>5,"B"=>217));

 /* Define the absissa serie */
 $MyData->addPoints(array(1,2,3,4,5,6,7,8,9,10,11,12,13,14,15,16,17,18,19,20,21,22,23,24),"Time");
 $MyData->setAbscissa("Time");

 /* Create the pChart object */
 $myPicture = new pImage(300,300,$MyData);
 $myPicture->drawGradientArea(0,0,300,300,DIRECTION_VERTICAL,array("StartR"=>200,"StartG"=>200,"StartB"=>200, "EndR"=>240,"EndG"=>240,"EndB"=>240,"Alpha"=>100));
 $myPicture->drawGradientArea(0,0,300,20,DIRECTION_HORIZONTAL,array("StartR"=>30,"StartG"=>30,"StartB"=>30, "EndR"=>100,"EndG"=>100,"EndB"=>100,"Alpha"=>100));
 $myPicture->drawLine(0,20,300,20,array("R"=>255,"G"=>255,"B"=>255));
 $RectangleSettings = array("R"=>180,"G"=>180,"B"=>180,"Alpha"=>100);

 /* Add a border to the picture */
 $myPicture->drawRectangle(0,0,299,299,array("R"=>0,"G"=>0,"B"=>0));

 /* Write the picture title */
 $myPicture->setFontProperties(array("FontName"=>"../fonts/Silkscreen.ttf","FontSize"=>6));
 $myPicture->drawText(10,13,"pRadar - Draw radar charts",array("R"=>255,"G"=>255,"B"=>255));

 /* Set the default font properties */
 $myPicture->setFontProperties(array("FontName"=>"../fonts/Forgotte.ttf","FontSize"=>10,"R"=>80,"G"=>80,"B"=>80));

 /* Enable shadow computing */
 $myPicture->setShadow(TRUE,array("X"=>2,"Y"=>2,"R"=>0,"G"=>0,"B"=>0,"Alpha"=>10));

 /* Create the pRadar object */
 $SplitChart = new pRadar();

 /* Draw a radar chart */
 $myPicture->setGraphArea(10,25,290,290);
 $Options = array("SkipLabels"=>3,"LabelMiddle"=>TRUE,"Layout"=>RADAR_LAYOUT_STAR,"BackgroundGradient"=>array("StartR"=>255, "StartG"=>255,"StartB"=>255,"StartAlpha"=>100,"EndR"=>207,"EndG"=>227,"EndB"=>125, "EndAlpha"=>50));
 $SplitChart->drawRadar($myPicture,$MyData,$Options);

 /* Render the picture (choose the best way) */
 $myPicture->autoOutput("pictures/example.radar.labels.png");
Sample script #3 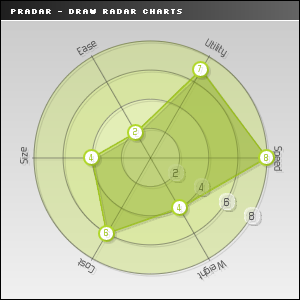
 /* pChart library inclusions */
 include("../class/pData.class.php");
 include("../class/pDraw.class.php");
 include("../class/pRadar.class.php");
 include("../class/pImage.class.php");

 /* Create and populate the pData object */
 $MyData = new pData();
 $MyData->addPoints(array(8,4,6,4,2,7),"Score");
 $MyData->setSerieDescription("Score","Application A");
 $MyData->setPalette("Score",array("R"=>157,"G"=>196,"B"=>22));

 /* Define the absissa serie */
 $MyData->addPoints(array("Speed","Weight","Cost","Size","Ease","Utility"),"Families");
 $MyData->setAbscissa("Families");

 /* Create the pChart object */
 $myPicture = new pImage(300,300,$MyData);
 $myPicture->drawGradientArea(0,0,300,300,DIRECTION_VERTICAL,array("StartR"=>200,"StartG"=>200,"StartB"=>200,"EndR"=>240,"EndG"=>240,"EndB"=>240,"Alpha"=>100));
 $myPicture->drawGradientArea(0,0,300,20,DIRECTION_HORIZONTAL,array("StartR"=>30,"StartG"=>30,"StartB"=>30,"EndR"=>100,"EndG"=>100,"EndB"=>100,"Alpha"=>100));
 $myPicture->drawLine(0,20,300,20,array("R"=>255,"G"=>255,"B"=>255));
 $RectangleSettings = array("R"=>180,"G"=>180,"B"=>180,"Alpha"=>100);

 /* Add a border to the picture */
 $myPicture->drawRectangle(0,0,299,299,array("R"=>0,"G"=>0,"B"=>0));

 /* Write the picture title */
 $myPicture->setFontProperties(array("FontName"=>"../fonts/Silkscreen.ttf","FontSize"=>6));
 $myPicture->drawText(10,13,"pRadar - Draw radar charts",array("R"=>255,"G"=>255,"B"=>255));

 /* Set the default font properties */
 $myPicture->setFontProperties(array("FontName"=>"../fonts/Forgotte.ttf","FontSize"=>10,"R"=>80,"G"=>80,"B"=>80));

 /* Enable shadow computing */
 $myPicture->setShadow(TRUE,array("X"=>2,"Y"=>2,"R"=>0,"G"=>0,"B"=>0,"Alpha"=>10));

 /* Create the pRadar object */
 $SplitChart = new pRadar();

 /* Draw a radar chart */
 $myPicture->setGraphArea(10,25,290,290);
 $Options = array("DrawPoly"=>TRUE,"WriteValues"=>TRUE,"ValueFontSize"=>8,"Layout"=>RADAR_LAYOUT_CIRCLE,"BackgroundGradient"=>array("StartR"=>255,"StartG"=>255,"StartB"=>255,"StartAlpha"=>100,"EndR"=>207,"EndG"=>227,"EndB"=>125,"EndAlpha"=>50));
 $SplitChart->drawRadar($myPicture,$MyData,$Options);

 /* Render the picture (choose the best way) */
 $myPicture->autoOutput("pictures/example.radar.values.png");
© Copyrights
Components used on this web site : Famfamfam icons has been made by Mark James, Rounded corners lite has been coded by Cameron Cooke and Tim Hutchison, SyntaxHighlighter has
been written by Alex Gorbatchev. pChart and this web site have been created by Jean-Damien POGOLOTTI. This documentation contains 185 pages and 56 comments. 415 users have registered.
This page has been rendered in 0,02 seconds. Wiki revision 1.37.
|