|
Language Reference » Surface charts » drawContour
|
|
Latest updates
Toolbox
Google AdSense
|
drawContour - Draw the contour of a specified elevation This function allows you to draw the contour of the given elevation. All the drawing parameters are given trough a $Format array. To learn more about this please read the Format array guide. Calling this function
drawContour($Threshold,$Format="")Where : Threshold is the threshold.
Format is an array containing the drawing parameters of the chart. Customisation array - Tune up your chart! It is possible to customize the rendering by playing with this array. Providing a detailled configuration is not mandatory. You‘ll see below a representation of all the customization possible : You can specify the color of the line with R,G,B,Alpha.
You can use ticks specifying their lenght with Ticks.
You can specify the padding value with Padding. Sample script 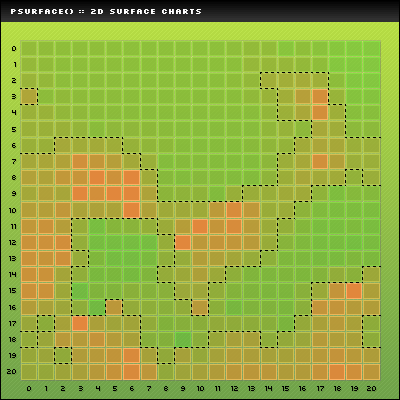
 /* pChart library inclusions */
 include("../class/pData.class.php");
 include("../class/pDraw.class.php");
 include("../class/pImage.class.php");
 include("../class/pSurface.class.php");

 /* Create the pChart object */
 $myPicture = new pImage(400,400);

 /* Create a solid background */
 $Settings = array("R"=>179, "G"=>217, "B"=>91, "Dash"=>1, "DashR"=>199, "DashG"=>237, "DashB"=>111);
 $myPicture->drawFilledRectangle(0,0,400,400,$Settings);

 /* Do a gradient overlay */
 $Settings = array("StartR"=>194, "StartG"=>231, "StartB"=>44, "EndR"=>43, "EndG"=>107, "EndB"=>58, "Alpha"=>50);
 $myPicture->drawGradientArea(0,0,400,400,DIRECTION_VERTICAL,$Settings);
 $myPicture->drawGradientArea(0,0,400,20,DIRECTION_VERTICAL,array("StartR"=>0,"StartG"=>0,"StartB"=>0,"EndR"=>50,"EndG"=>50,"EndB"=>50,"Alpha"=>100));

 /* Add a border to the picture */
 $myPicture->drawRectangle(0,0,399,399,array("R"=>0,"G"=>0,"B"=>0));

 /* Write the picture title */
 $myPicture->setFontProperties(array("FontName"=>"../fonts/Silkscreen.ttf","FontSize"=>6));
 $myPicture->drawText(10,13,"pSurface() :: 2D surface charts",array("R"=>255,"G"=>255,"B"=>255));

 /* Define the charting area */
 $myPicture->setGraphArea(20,40,380,380);
 $myPicture->drawFilledRectangle(20,40,380,380,array("R"=>255,"G"=>255,"B"=>255,"Surrounding"=>-200,"Alpha"=>20));

 $myPicture->setShadow(TRUE,array("X"=>1,"Y"=>1));

 /* Create the surface object */
 $mySurface = new pSurface($myPicture);

 /* Set the grid size */
 $mySurface->setGrid(20,20);

 /* Write the axis labels */
 $myPicture->setFontProperties(array("FontName"=>"../fonts/pf_arma_five.ttf","FontSize"=>6));
 $mySurface->writeXLabels(array("Position"=>LABEL_POSITION_BOTTOM));
 $mySurface->writeYLabels();

 /* Add random values */
 for($i=0; $i<=50; $i++) { $mySurface->addPoint(rand(0,20),rand(0,20),rand(0,100)); }

 /* Compute the missing points */
 $mySurface->computeMissing();

 /* Draw the surface chart */
 $mySurface->drawSurface(array("Border"=>TRUE,"Surrounding"=>40));

 /* Draw the contour with a threshold of 50 */
 $mySurface->drawContour(50,array("R"=>0,"G"=>0,"B"=>0));

 /* Render the picture (choose the best way) */
 $myPicture->autoOutput("pictures/example.surface.png");
© Copyrights
Components used on this web site : Famfamfam icons has been made by Mark James, Rounded corners lite has been coded by Cameron Cooke and Tim Hutchison, SyntaxHighlighter has
been written by Alex Gorbatchev. pChart and this web site have been created by Jean-Damien POGOLOTTI. This documentation contains 185 pages and 56 comments. 415 users have registered.
This page has been rendered in 0,01 seconds. Wiki revision 1.37.
|