|
Language Reference » Drawing functions » drawScale
|
|
Latest updates
Toolbox
Google AdSense
|
drawScale - Compute & draw the chart scale This function will compute and draw the scale of your charts. It handle both X & X-Y charts (which wasn‘t the case in pChart 1.x). If no series is defined as abcsissa or as X axis, a virtual X axis will be created numbered with data points IDs. It is possible to tune the rendering by playing with the $Format array. To learn more about this please read the Format array guide.
Calling this function
drawScale($Format="");Where : Format is an array containing the drawing parameters of the arrow. Customisation array - Tune up your scales! It is possible to customize the way your scale will be rendered by playing with this array. Providing a detailled configuration is not mandatory, by default the axis will be drawn black in the Left / Right mode. The scale orientation can be set with Pos, valid values are SCALE_POS_LEFTRIGHT and SCALE_POS_TOPBOTTOM
You can specify the rotation of the X Axis labels with LabelRotation.
The minimum height of a scale div can be set using MinDivHeight.
The scaling factors can be set using Factors.
The X Axis margin can be set using XMargin. By default the margin on this axis are set to AUTO but you can specify an integer.
The Y Axis margin can be set using YMargin.
You can remove the X axis but keep the vertical ticks setting RemoveXAxis to TRUE.
The space between two scales on the same side can be set using ScaleSpacing.
You can specify if you want to draw the X grid lines setting DrawXLines to TRUE or FALSE.
You can specify if you want to draw the Y grid lines setting DrawYLines to ALL, NONE or to an array containing the axis IDs.
You can draw dashed grid lines setting GridTicks to the width of the ticks.
You can specify the grid color using GridR,GridG,GridB.
You can specify the grid alpha factor using GridAlpha.
You can specify the axis color using AxisR,AxisG,AxisB.
You can specify the axis alpha factor using AxisAlpha.
The inner ticks width can be set using InnerTickWidth.
The outer ticks width can be set using OuterTickWidth.
You can specify the ticks color using TickR,TickG,TickB.
You can specify the ticks alpha factor using TickAlpha.
If you want to draw the subticks of the Y axis set DrawSubTicks to TRUE.
The inner subticks width can be set using InnerSubTickWidth.
The outer subticks width can be set using OuterSubTickWidth.
You can specify the subticks color using SubTickR,SubTickG,SubTickB.
You can specify the subticks alpha factor using SubTickAlpha.
You can specify if you want to draw the axis arrows setting DrawArrows to TRUE or FALSE.
You can set the arrow size usingArrowSize.
You can choose to display a 2-colors cycling background setting CycleBackground to TRUE.
First background cycling color can be defined with BackgroundR1,BackgroundG1,BackgroundB1,BackgroundAlpha1.
2nd background cycling color can be defined with BackgroundR2,BackgroundG2,BackgroundB2,BackgroundAlpha2.
You can skip specified number of X labels using LabelSkip. If you choose to skip some labels using the LabelSkip parameter then you can adjust the rendering of the ticks that will have no labels with the following parameters : You can change the dash interval of the Y lines setting GridTicks to the width of the ticks.
You can specify the grid color using SkippedAxisR,SkippedAxisG,SkippedAxisB.
You can specify the alpha factor of the grid using SkippedAxisAlpha.
You can specify the ticks color using SkippedTickR,SkippedTickG,SkippedTickB.
You can specify the alpha factor of the ticks using SkippedTickAlpha.
The inner ticks width can be set using SkippedInnerTickWidth.
The outer ticks width can be set using SkippedOuterTickWidth. You can choose to display all X labels or only the ones that are different from the previously written. This can be usefull when using dates to only display different dates. Use the LabelingMethod parameter to set : LABELING_ALL will write all X labels.
LABELING_DIFFERENT will only write labels that are different than the previously written one.. Depending on the chart you‘ll draw, you can define the way the scale will be computed with the Mode parameter : SCALE_MODE_FLOATING for min/max automatic scaling.
SCALE_MODE_START0 for fixed min to 0.
SCALE_MODE_ADDALL for stacked charts.
SCALE_MODE_ADDALL_START0 for stacked charts with a fixed min to 0.
SCALE_MODE_MANUAL to fix manually the min & max values. If you choose the manual option, you‘ll have to provide an array with the ManualScale parameter to provide the min & max values per axis. This array should have the following structure :
$AxisBoundaries = array(0=>array("Min"=>0,"Max"=>100),1=>array("Min"=>10,"Max"=>20));
Sample script #1 
 $MyData = new pData();

 /* Prepare some nice data & axis config */
 $MyData->addPoints(array(24,-25,26,25,25),"Temperature");
 $MyData->setAxisName(0,"Temperatures");
 $MyData->addPoints(array("Jan","Feb","Mar","Apr","May","Jun"),"Labels");
 $MyData->setSerieDescription("Labels","Months");
 $MyData->setAbscissa("Labels");

 /* Define the graph area and do some makeup */
 $myPicture->setGraphArea(60,60,660,190);
 $myPicture->drawText(350,55,"My chart title",array("FontSize"=>20,"Align"=>TEXT_ALIGN_BOTTOMMIDDLE));
 $myPicture->drawFilledRectangle(60,60,660,190,array("R"=>255,"G"=>255,"B"=>255,"Surrounding"=>-200,"Alpha"=>10));

 /* Compute and draw the scale */
 $myPicture->setFontProperties(array("FontName"=>"fonts/pf_arma_five.ttf","FontSize"=>6));
 $myPicture->drawScale(array("DrawSubTicks"=>TRUE,"DrawArrows"=>TRUE,"ArrowSize"=>6));
This is a simple example using two data serie, one numeric to chart and one to use as abscissa labels. Sample script #2 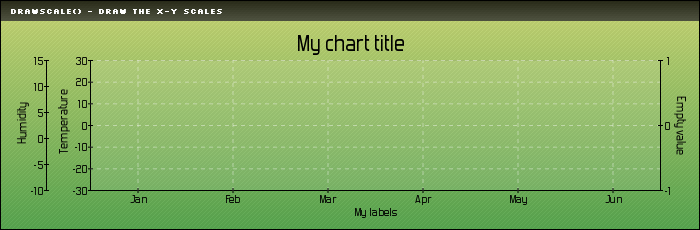
 $MyData = new pData();

 /* Prepare some nice data & axis config */
 $MyData->addPoints(array(24,-25,26,25,25),"Temperature");
 $MyData->addPoints(array(1,2,VOID,9,10),"Humidity 1");
 $MyData->addPoints(array(1,VOID,7,-9,0),"Humidity 2");
 $MyData->addPoints(array(-1,-1,-1,-1,-1),"Humidity 3");
 $MyData->addPoints(array(0,0,0,0,0),"Vide");
 $MyData->setSerieOnAxis("Temperature",0);
 $MyData->setSerieOnAxis("Humidity 1",1);
 $MyData->setSerieOnAxis("Humidity 2",1);
 $MyData->setSerieOnAxis("Humidity 3",1);
 $MyData->setSerieOnAxis("Vide",2);
 $MyData->setAxisPosition(2,AXIS_POSITION_RIGHT);
 $MyData->setAxisName(0,"Temperature");
 $MyData->setAxisName(1,"Humidity");
 $MyData->setAxisName(2,"Empty value");

 /* Bind a data serie to the X axis */
 $MyData->addPoints(array("Jan","Feb","Mar","Apr","May","Jun"),"Labels");
 $MyData->setSerieDescription("Labels","My labels");
 $MyData->setAbscissa("Labels");

 /* Define the graph area and do some makeup */
 $myPicture->setGraphArea(90,60,660,190);
 $myPicture->drawText(350,55,"My chart title",array("FontSize"=>20,"Align"=>TEXT_ALIGN_BOTTOMMIDDLE));
 $myPicture->drawFilledRectangle(90,60,660,190,array("R"=>255,"G"=>255,"B"=>255,"Surrounding"=>-200,"Alpha"=>10));

 /* Compute and draw the scale */
 $myPicture->drawScale(array("DrawYLines"=>array(0)));
This example compute & draw the scale. Only the Axis with an ID of 0 (Temperature) will have horizontal lines because of the DrawYLines option specified in the drawScale call. Sample script #3 
 $MyData = new pData();

 /* Prepare some nice data & axis config */
 $MyData = new pData();
 $MyData->addPoints(array(24,13,14),"Temperature");
 $MyData->setAxisName(0,"Temperatures");
 $MyData->addPoints(array("Sample #1","Sample #2","Sample #3"),"Labels");
 $MyData->setAbscissa("Labels");

 /* Define the graph area and do some makeup */
 $myPicture->setGraphArea(60,90,660,210);
 $myPicture->drawText(360,55,"My chart title",array("FontSize"=>20,"Align"=>TEXT_ALIGN_BOTTOMMIDDLE));
 $myPicture->drawFilledRectangle(60,90,660,210,array("R"=>255,"G"=>255,"B"=>255,"Surrounding"=>-200,"Alpha"=>10));

 /* Compute and draw the scale */
 $myPicture->drawScale(array("AutoAxisLabels"=>FALSE,"Pos"=>SCALE_POS_TOPBOTTOM));
This example shows how you can invert the X and Y axis. Sample script #4 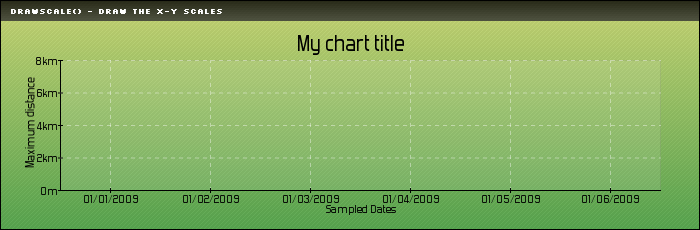
 $MyData = new pData();

 /* Prepare some nice data & axis config */
 $MyData = new pData();
 $MyData->addPoints(array(1700,2500,7800,4500,3150),"Distance");
 $MyData->setAxisName(0,"Maximum distance");
 $MyData->setAxisUnit(0,"m");
 $MyData->setAxisDisplay(0,AXIS_FORMAT_METRIC);

 /* Create the X serie */
 $MyData->addPoints(array(1230768000,1233446400,1235865600,1238544000,1241136000,1243814400),"Timestamp");
 $MyData->setSerieDescription("Timestamp","Sampled Dates");
 $MyData->setAbscissa("Timestamp");
 $MyData->setXAxisDisplay(AXIS_FORMAT_DATE);

 /* Define the graph area and do some makeup */
 $myPicture->setGraphArea(60,60,660,190);
 $myPicture->drawText(350,55,"My chart title",array("FontSize"=>20,"Align"=>TEXT_ALIGN_BOTTOMMIDDLE));
 $myPicture->drawFilledRectangle(60,60,660,190,array("R"=>255,"G"=>255,"B"=>255,"Surrounding"=>-200,"Alpha"=>10));

 /* Compute and draw the scale */
 $myPicture->drawScale();
This example shows how the drawScale function handle the axis values formatting. Sample script #5 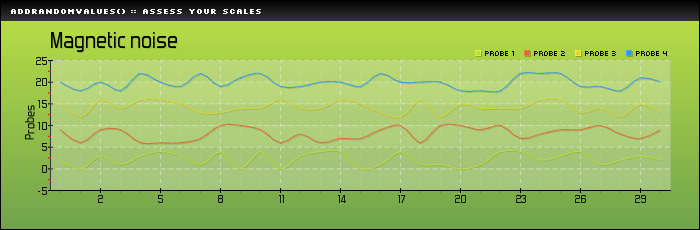
 /* pChart library inclusions */
 include("../class/pData.class.php");
 include("../class/pDraw.class.php");
 include("../class/pImage.class.php");

 /* Create the pData object with some random values*/
 $MyData = new pData();
 $MyData->addRandomValues("Probe 1",array("Values"=>30,"Min"=>0,"Max"=>4));
 $MyData->addRandomValues("Probe 2",array("Values"=>30,"Min"=>6,"Max"=>10));
 $MyData->addRandomValues("Probe 3",array("Values"=>30,"Min"=>12,"Max"=>16));
 $MyData->addRandomValues("Probe 4",array("Values"=>30,"Min"=>18,"Max"=>22));
 $MyData->setAxisName(0,"Probes");

 /* Create the pChart object */
 $myPicture = new pImage(700,230,$MyData);

 /* Create a solid background */
 $Settings = array("R"=>179, "G"=>217, "B"=>91, "Dash"=>1, "DashR"=>199, "DashG"=>237, "DashB"=>111);
 $myPicture->drawFilledRectangle(0,0,700,230,$Settings);

 /* Do a gradient overlay */
 $Settings = array("StartR"=>194, "StartG"=>231, "StartB"=>44, "EndR"=>43, "EndG"=>107, "EndB"=>58, "Alpha"=>50);
 $myPicture->drawGradientArea(0,0,700,230,DIRECTION_VERTICAL,$Settings);
 $myPicture->drawGradientArea(0,0,700,20,DIRECTION_VERTICAL,array("StartR"=>0,"StartG"=>0,"StartB"=>0,"EndR"=>50,"EndG"=>50,"EndB"=>50,"Alpha"=>100));

 /* Add a border to the picture */
 $myPicture->drawRectangle(0,0,699,229,array("R"=>0,"G"=>0,"B"=>0));

 /* Write the picture title */
 $myPicture->setFontProperties(array("FontName"=>"../fonts/Silkscreen.ttf","FontSize"=>6));
 $myPicture->drawText(10,13,"addRandomValues() :: assess your scales",array("R"=>255,"G"=>255,"B"=>255));

 /* Draw the scale */
 $myPicture->setFontProperties(array("FontName"=>"../fonts/Forgotte.ttf","FontSize"=>11));
 $myPicture->setGraphArea(50,60,670,190);
 $myPicture->drawFilledRectangle(50,60,670,190,array("R"=>255,"G"=>255,"B"=>255,"Surrounding"=>-200,"Alpha"=>10));
 $myPicture->drawScale(array("CycleBackground"=>TRUE,"LabelSkip"=>3,"DrawSubTicks"=>TRUE));

 /* Graph title */
 $myPicture->setShadow(TRUE,array("X"=>1,"Y"=>1,"R"=>0,"G"=>0,"B"=>0,"Alpha"=>10));
 $myPicture->drawText(50,52,"Magnetic noise",array("FontSize"=>20,"Align"=>TEXT_ALIGN_BOTTOMLEFT));

 /* Draw the data series */
 $myPicture->setFontProperties(array("FontName"=>"../fonts/pf_arma_five.ttf","FontSize"=>6));
 $myPicture->drawSplineChart();
 $myPicture->setShadow(FALSE);

 /* Write the legend */
 $myPicture->drawLegend(475,50,array("Style"=>LEGEND_NOBORDER,"Mode"=>LEGEND_HORIZONTAL));

 /* Render the picture (choose the best way) */
 $myPicture->autoOutput("pictures/example.addRandomValues.png");
This example shows how to play with the skipped X axis labels. Sample script #6 
 /* pChart library inclusions */
 include("../class/pData.class.php");
 include("../class/pDraw.class.php");
 include("../class/pImage.class.php");

 /* Create and populate the pData object */
 $MyData = new pData();
 $MyData->addPoints(array(24,-25,26,25,25),"Temperature");
 $MyData->setAxisName(0,"Temperatures");
 $MyData->addPoints(array("Jan","Feb","Mar","Apr","May","Jun"),"Labels");
 $MyData->setSerieDescription("Labels","Months");
 $MyData->setAbscissa("Labels");

 /* Create the pChart object */
 $myPicture = new pImage(700,230,$MyData);

 /* Draw the background */
 $Settings = array("R"=>170, "G"=>183, "B"=>87, "Dash"=>1, "DashR"=>190, "DashG"=>203, "DashB"=>107);
 $myPicture->drawFilledRectangle(0,0,700,230,$Settings);

 /* Overlay with a gradient */
 $Settings = array("StartR"=>219, "StartG"=>231, "StartB"=>139, "EndR"=>1, "EndG"=>138, "EndB"=>68, "Alpha"=>50);
 $myPicture->drawGradientArea(0,0,700,230,DIRECTION_VERTICAL,$Settings);
 $myPicture->drawGradientArea(0,0,700,20,DIRECTION_VERTICAL,array("StartR"=>0,"StartG"=>0,"StartB"=>0,"EndR"=>50,"EndG"=>50,"EndB"=>50,"Alpha"=>80));

 /* Add a border to the picture */
 $myPicture->drawRectangle(0,0,699,229,array("R"=>0,"G"=>0,"B"=>0));

 /* Write the picture title */
 $myPicture->setFontProperties(array("FontName"=>"../fonts/Silkscreen.ttf","FontSize"=>6));
 $myPicture->drawText(10,13,"drawScale() - draw the X-Y scales",array("R"=>255,"G"=>255,"B"=>255));

 /* Set the default font */
 $myPicture->setFontProperties(array("FontName"=>"../fonts/Forgotte.ttf","FontSize"=>11));

 /* Write the chart title */
 $myPicture->setGraphArea(60,60,660,190);
 $myPicture->drawText(350,55,"My chart title",array("FontSize"=>20,"Align"=>TEXT_ALIGN_BOTTOMMIDDLE));
 $myPicture->drawFilledRectangle(60,60,660,190,array("R"=>255,"G"=>255,"B"=>255,"Surrounding"=>-200,"Alpha"=>10));

 /* Set the default font */
 $myPicture->setFontProperties(array("FontName"=>"../fonts/pf_arma_five.ttf","FontSize"=>6));

 /* Draw the scale */
 $AxisBoundaries = array(0=>array("Min"=>0,"Max"=>100));
 $ScaleSettings  = array("Mode"=>SCALE_MODE_MANUAL,"ManualScale"=>$AxisBoundaries,"DrawSubTicks"=>TRUE,"DrawArrows"=>TRUE,"ArrowSize"=>6);
 $myPicture->drawScale($ScaleSettings);

 /* Render the picture (choose the best way) */
 $myPicture->autoOutput("pictures/example.drawScale.png");
This example will create a manual scale going from 0 to 100. Sample script #7 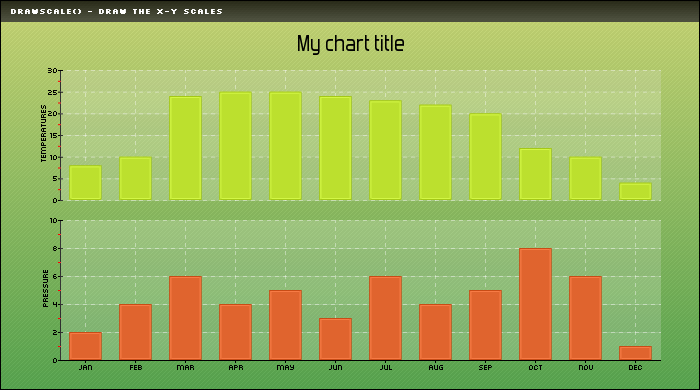
 /* pChart library inclusions */
 include("../class/pData.class.php");
 include("../class/pDraw.class.php");
 include("../class/pImage.class.php");

 /* Create and populate the pData object */
 $MyData = new pData();
 $MyData->addPoints(array(8,10,24,25,25,24,23,22,20,12,10,4),"Temperature");
 $MyData->addPoints(array(2,4,6,4,5,3,6,4,5,8,6,1),"Pressure");
 $MyData->setSerieDrawable("Pressure",FALSE);
 $MyData->setAxisName(0,"Temperatures");
 $MyData->addPoints(array("Jan","Feb","Mar","Apr","May","Jun","Jul","Aug","Sep","Oct","Nov","Dec"),"Labels");
 $MyData->setSerieDescription("Labels","Months");
 $MyData->setAbscissa("Labels");

 /* Create the pChart object */
 $myPicture = new pImage(700,390,$MyData);

 /* Draw the background */
 $Settings = array("R"=>170, "G"=>183, "B"=>87, "Dash"=>1, "DashR"=>190, "DashG"=>203, "DashB"=>107);
 $myPicture->drawFilledRectangle(0,0,700,390,$Settings);

 /* Overlay with a gradient */
 $Settings = array("StartR"=>219, "StartG"=>231, "StartB"=>139, "EndR"=>1, "EndG"=>138, "EndB"=>68, "Alpha"=>50);
 $myPicture->drawGradientArea(0,0,700,390,DIRECTION_VERTICAL,$Settings);
 $myPicture->drawGradientArea(0,0,700,20,DIRECTION_VERTICAL,array("StartR"=>0,"StartG"=>0,"StartB"=>0,"EndR"=>50,"EndG"=>50,"EndB"=>50,"Alpha"=>80));

 /* Add a border to the picture */
 $myPicture->drawRectangle(0,0,699,389,array("R"=>0,"G"=>0,"B"=>0));

 /* Write the picture title */
 $myPicture->setFontProperties(array("FontName"=>"../fonts/Silkscreen.ttf","FontSize"=>6));
 $myPicture->drawText(10,13,"drawScale() - draw the X-Y scales",array("R"=>255,"G"=>255,"B"=>255));

 /* Write the chart title */
 $myPicture->setFontProperties(array("FontName"=>"../fonts/Forgotte.ttf","FontSize"=>11));
 $myPicture->drawText(350,55,"My chart title",array("FontSize"=>20,"Align"=>TEXT_ALIGN_BOTTOMMIDDLE));

 /* Define the 1st chart area */
 $myPicture->setGraphArea(60,70,660,200);
 $myPicture->setFontProperties(array("FontName"=>"../fonts/pf_arma_five.ttf","FontSize"=>6));

 /* Draw the scale */
 $scaleSettings = array("DrawSubTicks"=>TRUE,"CycleBackground"=>TRUE,"RemoveXAxis"=>TRUE);
 $myPicture->drawScale($scaleSettings);
 $myPicture->drawBarChart(array("Surrounding"=>-30,"InnerSurrounding"=>30));

 /* Define the 2nd chart area */
 $myPicture->setGraphArea(60,220,660,360);
 $myPicture->setFontProperties(array("FontName"=>"../fonts/pf_arma_five.ttf","FontSize"=>6));

 /* Draw the scale */
 $scaleSettings = array("DrawSubTicks"=>TRUE,"CycleBackground"=>TRUE);
 $MyData->setSerieDrawable("Temperature",FALSE);
 $MyData->setSerieDrawable("Pressure",TRUE);
 $MyData->setAxisName(0,"Pressure");
 $myPicture->drawScale($scaleSettings);
 $myPicture->drawBarChart(array("Surrounding"=>-30,"InnerSurrounding"=>30));

 /* Render the picture (choose the best way) */
 $myPicture->autoOutput("pictures/example.drawScale.labels.png");
© Copyrights
Components used on this web site : Famfamfam icons has been made by Mark James, Rounded corners lite has been coded by Cameron Cooke and Tim Hutchison, SyntaxHighlighter has
been written by Alex Gorbatchev. pChart and this web site have been created by Jean-Damien POGOLOTTI. This documentation contains 185 pages and 56 comments. 415 users have registered.
This page has been rendered in 0,02 seconds. Wiki revision 1.37.
|