|
Language Reference » Dataset functions » setAxisColor
|
|
Latest updates
Toolbox
Google AdSense
|
setAxisColor - Set the color of a specific axis This function allows you to specify the color of a specific axis. If you specify a color for an axis, this will overide the default colors you can pass to the drawScale function. Parameters are given trough a $Format array. To learn more about this please read the Format array guide. Calling this function
setAxisColor($AxisID,$Format="");Where : AxisID is the ID of the axis you want to customize.
Format is an array containing the drawing parameters of the arrow.
Customisation array - Tune up your axis! It is possible to customize the color of the axis by playing with this array. Axis color can be set with R, G, B. Sample script 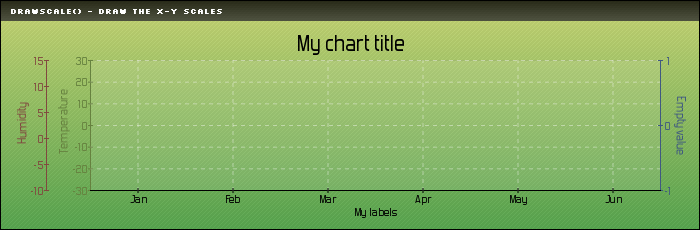 /* Create your pData object */
$MyData = new pData();
$MyData->addPoints(array(24,-25,26,25,25),"Temperature");
$MyData->addPoints(array(1,2,VOID,9,10),"Humidity 1");
$MyData->addPoints(array(1,VOID,7,-9,0),"Humidity 2");
$MyData->addPoints(array(-1,-1,-1,-1,-1),"Humidity 3");
$MyData->addPoints(array(0,0,0,0,0),"Vide");
$MyData->setSerieOnAxis("Temperature",0);
$MyData->setSerieOnAxis("Humidity 1",1);
$MyData->setSerieOnAxis("Humidity 2",1);
$MyData->setSerieOnAxis("Humidity 3",1);
$MyData->setSerieOnAxis("Vide",2);
$MyData->setAxisPosition(2,AXIS_POSITION_RIGHT);
$MyData->setAxisName(0,"Temperature");
$MyData->setAxisName(1,"Humidity");
$MyData->setAxisName(2,"Empty value");
/* Associate a color to each axis */
$MyData->setAxisColor(0,array("R"=>102,"G"=>129,"B"=>63));
$MyData->setAxisColor(1,array("R"=>129,"G"=>72,"B"=>63));
$MyData->setAxisColor(2,array("R"=>63,"G"=>89,"B"=>129));
/* Create a labelled X axis */
$MyData->addPoints(array("Jan","Feb","Mar","Apr","May","Jun"),"Labels");
$MyData->setSerieDescription("Labels","My labels");
$MyData->setAbscissa("Labels");
© Copyrights
Components used on this web site : Famfamfam icons has been made by Mark James, Rounded corners lite has been coded by Cameron Cooke and Tim Hutchison, SyntaxHighlighter has
been written by Alex Gorbatchev. pChart and this web site have been created by Jean-Damien POGOLOTTI. This documentation contains 185 pages and 56 comments. 415 users have registered.
This page has been rendered in 0,01 seconds. Wiki revision 1.37.
|