|
Language Reference » Dataset functions » setAbscissaName
|
|
Latest updates
Toolbox
Google AdSense
|
setAbscissaName - Set the name of the abcissa axis This function allows you to define the name of the abcissa axis (X). When drawing the scale if a name is associated it will be written bellow the axis values. Calling this function
setAbscissaName($Name) Where : Name is the new name of the abscissa axis. Sample script 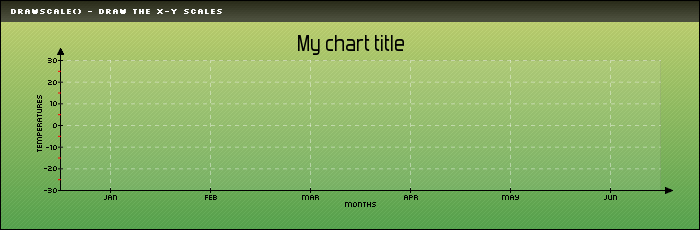
 /* pChart library inclusions */
 include("../class/pData.class.php");
 include("../class/pDraw.class.php");
 include("../class/pImage.class.php");

 /* Create and populate the pData object */
 $MyData = new pData();
 $MyData->addPoints(array(24,-25,26,25,25),"Temperature");
 $MyData->setAxisName(0,"Temperatures");
 $MyData->addPoints(array("Jan","Feb","Mar","Apr","May","Jun"),"Labels");
 $MyData->setSerieDescription("Labels","Months");
 $MyData->setAbscissa("Labels");
 $MyData->setAbscissaName("Months");

 /* Create the pChart object */
 $myPicture = new pImage(700,230,$MyData);

 /* Draw the background */
 $Settings = array("R"=>170, "G"=>183, "B"=>87, "Dash"=>1, "DashR"=>190, "DashG"=>203, "DashB"=>107);
  $myPicture->drawFilledRectangle(0,0,700,230,$Settings);

 /* Overlay with a gradient */
 $Settings = array("StartR"=>219, "StartG"=>231, "StartB"=>139, "EndR"=>1, "EndG"=>138, "EndB"=>68, "Alpha"=>50);
  $myPicture->drawGradientArea(0,0,700,230,DIRECTION_VERTICAL,$Settings);
 $myPicture->drawGradientArea(0,0,700,20,DIRECTION_VERTICAL,array("StartR"=>0,"StartG"=>0,"StartB"=>0,"EndR"=>50,"EndG"=>50,"EndB"=>50,"Alpha"=>80));

 /* Add a border to the picture */
 $myPicture->drawRectangle(0,0,699,229,array("R"=>0,"G"=>0,"B"=>0));

 /* Write the picture title */
 $myPicture->setFontProperties(array("FontName"=>"../fonts/Silkscreen.ttf","FontSize"=>6));
  $myPicture->drawText(10,13,"drawScale() - draw the X-Y scales",array("R"=>255,"G"=>255,"B"=>255));

 /* Set the default font */
 $myPicture->setFontProperties(array("FontName"=>"../fonts/Forgotte.ttf","FontSize"=>11));

 /* Write the chart title */
 $myPicture->setGraphArea(60,60,660,190);
 $myPicture->drawText(350,55,"My chart title",array("FontSize"=>20,"Align"=>TEXT_ALIGN_BOTTOMMIDDLE));
  $myPicture->drawFilledRectangle(60,60,660,190,array("R"=>255,"G"=>255,"B"=>255,"Surrounding"=>-200,"Alpha"=>10));

 /* Set the default font */
 $myPicture->setFontProperties(array("FontName"=>"../fonts/pf_arma_five.ttf","FontSize"=>6));

 /* Draw the scale */
 $myPicture->drawScale(array("DrawSubTicks"=>TRUE,"DrawArrows"=>TRUE,"ArrowSize"=>6));

 /* Render the picture (choose the best way) */
 $myPicture->autoOutput("pictures/example.drawScale.png");
© Copyrights
Components used on this web site : Famfamfam icons has been made by Mark James, Rounded corners lite has been coded by Cameron Cooke and Tim Hutchison, SyntaxHighlighter has
been written by Alex Gorbatchev. pChart and this web site have been created by Jean-Damien POGOLOTTI. This documentation contains 185 pages and 56 comments. 415 users have registered.
This page has been rendered in 0,01 seconds. Wiki revision 1.37.
|