|
Language Reference » Dataset functions » createFunctionSerie
|
|
Latest updates
Toolbox
Google AdSense
|
createFunctionSerie - Create a serie based on a formula This function allow you to create a data serie based on a mathematical formula. It is possible to set extra parameters with the $Option array. To learn more about this please read the Format array guide.
Calling this function
createFunctionSerie($SerieName,$Formula="",$Options="");Where : SerieName is the name of the serie to create.
Formula is the mathematical formula to evaluate.
Option is an array containing some extra parameters. Customisation array - Extra parameters It is possible to give extra parameters to the evaluation engine. If nothing is provided, the z variable will be evaluated between -10 to +10 with a step of 1. The range to evaluate can be defined with MinX and MaxX.
The resolution can be set with XStep.
You can name the serie based on the formula setting AutoDescription to TRUE.
You can record an abscissa serie setting RecordAbscissa to TRUE.
You can provide the abscissa serie name with AbscissaSerie. Sample script #1 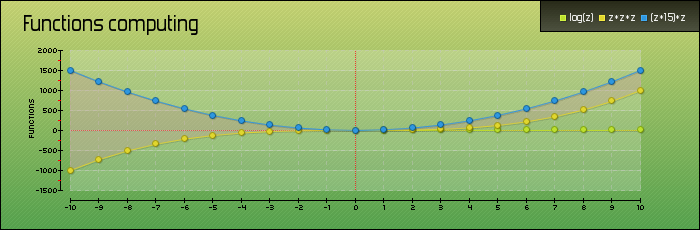
 /* pChart library inclusions */
 include("../class/pData.class.php");
 include("../class/pDraw.class.php");
 include("../class/pImage.class.php");

 /* Create and populate the pData object */
 $MyData = new pData();
 $MyData->createFunctionSerie("Serie 1","log(z)",array("AutoDescription"=>TRUE,"MinX"=>-10,"MaxX"=>10,"XStep"=>1,"RecordAbscissa"=>TRUE,"AbscissaSerie"=>"Labels"));
 $MyData->createFunctionSerie("Serie 2","z*z*z",array("AutoDescription"=>TRUE,"MinX"=>-10,"MaxX"=>10,"XStep"=>1));
 $MyData->createFunctionSerie("Serie 3","(z*15)*z",array("AutoDescription"=>TRUE,"MinX"=>-10,"MaxX"=>10,"XStep"=>1));
 $MyData->setAxisName(0,"functions");
 $MyData->setAbscissa("Labels");

 /* Create the pChart object */
 $myPicture = new pImage(700,230,$MyData);

 /* Turn of Antialiasing */
 $myPicture->Antialias = FALSE;

 /* Draw the background */
 $Settings = array("R"=>170, "G"=>183, "B"=>87, "Dash"=>1, "DashR"=>190, "DashG"=>203, "DashB"=>107);
 $myPicture->drawFilledRectangle(0,0,700,230,$Settings);

 /* Overlay some gradients */
 $Settings = array("StartR"=>219, "StartG"=>231, "StartB"=>139, "EndR"=>1, "EndG"=>138, "EndB"=>68, "Alpha"=>50);
 $myPicture->drawGradientArea(0,0,700,230,DIRECTION_VERTICAL,$Settings);
 $myPicture->drawGradientArea(540,0,700,30,DIRECTION_VERTICAL,array("StartR"=>0,"StartG"=>0,"StartB"=>0,"EndR"=>50,"EndG"=>50,"EndB"=>50,"Alpha"=>80));

 /* Add a border to the picture */
 $myPicture->drawRectangle(0,0,699,229,array("R"=>0,"G"=>0,"B"=>0));
 $myPicture->drawRectangle(540,0,699,31,array("R"=>0,"G"=>0,"B"=>0));

 /* Write the chart title */
 $myPicture->setFontProperties(array("FontName"=>"../fonts/Forgotte.ttf","FontSize"=>20));
 $myPicture->drawText(110,35,"Functions computing",array("Align"=>TEXT_ALIGN_BOTTOMMIDDLE));

 /* Set the default font */
 $myPicture->setFontProperties(array("FontName"=>"../fonts/pf_arma_five.ttf","FontSize"=>6));

 /* Define the chart area */
 $myPicture->setGraphArea(60,40,650,200);

 /* Draw the scale */
 $scaleSettings = array("XMargin"=>10,"YMargin"=>10,"Floating"=>TRUE,"GridR"=>200,"GridG"=>200, "GridB"=>200,"DrawSubTicks"=>TRUE,"CycleBackground"=>TRUE);
 $myPicture->drawScale($scaleSettings);

 /* Turn on Antialiasing */
 $myPicture->Antialias = TRUE;

 /* Turn on shadows */
 $myPicture->setShadow(TRUE,array("X"=>1,"Y"=>1,"R"=>0,"G"=>0,"B"=>0,"Alpha"=>10));

 /* Draw the 0 threshold */
 $myPicture->drawThreshold(0,array("Alpha"=>70,"Ticks"=>1));
 $myPicture->drawXThreshold(10,array("Alpha"=>70,"Ticks"=>1));

 /* Draw a zone chart */
 $myPicture->drawZoneChart("Serie 2","Serie 3",array("AreaR"=>200,"AreaAlpha"=>30));

 /* Draw the line chart */
 $myPicture->drawLineChart();
 $myPicture->drawPlotChart(array("PlotBorder"=>TRUE,"BorderSize"=>1,"Surrounding"=>-60,"BorderAlpha"=>80));

 /* Write the chart legend */
 $myPicture->setFontProperties(array("FontName"=>"../fonts/Forgotte.ttf","FontSize"=>11,"R"=>255,"G"=>255,"B"=>255));
 $myPicture->drawLegend(560,15,array("Style"=>LEGEND_NOBORDER,"Mode"=>LEGEND_HORIZONTAL));

 /* Render the picture (choose the best way) */
 $myPicture->autoOutput("pictures/example.createFunctionSerie.png");
© Copyrights
Components used on this web site : Famfamfam icons has been made by Mark James, Rounded corners lite has been coded by Cameron Cooke and Tim Hutchison, SyntaxHighlighter has
been written by Alex Gorbatchev. pChart and this web site have been created by Jean-Damien POGOLOTTI. This documentation contains 185 pages and 56 comments. 415 users have registered.
This page has been rendered in 0,01 seconds. Wiki revision 1.37.
|