|
Language Reference » Dataset functions » setSerieTicks
|
|
Latest updates
Toolbox
Google AdSense
|
setSerieTicks - Draw series with dotted lines This function allows you to draw your series with ticks instead of solid lines. Calling this function
setSerieTicks($Series,$Width); Where : Series is the name of the serie. (or an array of names)
Width is the width of the ticks. Setting this value to 0 will draw solid lines. Sample script #1
 /* Create the pData object */
 $MyData = new pData();

 /* Populate some data */
 $MyData->addPoints(array(24,25,26,25,25),"My Serie 1");

 /* Use ticks while drawing "My Serie 1" */
 $MyData->setSerieTicks("My Serie 1",4);
"My Serie 1" will be draw with dotted lines. Sample script #2 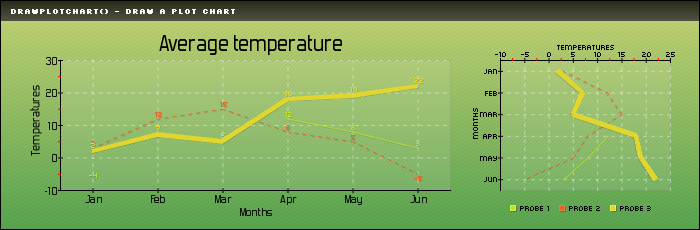
 /* Build a dataset */
 $MyData = new pData();
 $MyData->addPoints(array(-4,VOID,VOID,12,8,3),"Probe 1");
 $MyData->addPoints(array(3,12,15,8,5,-5),"Probe 2");
 $MyData->addPoints(array(2,7,5,18,19,22),"Probe 3");
 $MyData->setSerieTicks("Probe 2",4);
 $MyData->setAxisName(0,"Temperatures");
 $MyData->addPoints(array("Jan","Feb","Mar","Apr","May","Jun"),"Labels");
 $MyData->setSerieDescription("Labels","Months");
 $MyData->setAbscissa("Labels");

 /* Create the 1st chart*/
 $myPicture->setGraphArea(60,60,450,190);
 $myPicture->drawFilledRectangle(60,60,450,190,array("R"=>255,"G"=>255,"B"=>255,"Surrounding"=>-200,"Alpha"=>10));
 $myPicture->drawScale(array("DrawSubTicks"=>TRUE));
 $myPicture->setShadow(TRUE,array("X"=>1,"Y"=>1,"R"=>0,"G"=>0,"B"=>0,"Alpha"=>10));
 $myPicture->setFontProperties(array("FontName"=>"fonts/pf_arma_five.ttf","FontSize"=>6));
 $myPicture->drawLineChart(array("DisplayValues"=>TRUE,"DisplayColor"=>DISPLAY_AUTO));
 $myPicture->setShadow(FALSE);

 /* Create the 2nd chart */
 $myPicture->setGraphArea(500,60,670,190);
 $myPicture->drawFilledRectangle(500,60,670,190,array("R"=>255,"G"=>255,"B"=>255,"Surrounding"=>-200,"Alpha"=>10));
 $myPicture->drawScale(array("Pos"=>SCALE_POS_TOPBOTTOM,"DrawSubTicks"=>TRUE));
 $myPicture->setShadow(TRUE,array("X"=>1,"Y"=>1,"R"=>0,"G"=>0,"B"=>0,"Alpha"=>10));
 $myPicture->drawLineChart();
 $myPicture->setShadow(FALSE);

 /* Write the legend*/
 $myPicture->drawLegend(510,205,array("Style"=>LEGEND_NOBORDER,"Mode"=>LEGEND_HORIZONTAL));
© Copyrights
Components used on this web site : Famfamfam icons has been made by Mark James, Rounded corners lite has been coded by Cameron Cooke and Tim Hutchison, SyntaxHighlighter has
been written by Alex Gorbatchev. pChart and this web site have been created by Jean-Damien POGOLOTTI. This documentation contains 185 pages and 56 comments. 415 users have registered.
This page has been rendered in 0,01 seconds. Wiki revision 1.37.
|