|
Language Reference » Charting functions » drawSplitPath
|
|
Latest updates
Toolbox
Google AdSense
|
drawSplitPath - Draw splitted path charts This function allows you to draw a splitted path chart. All the drawing parameters are given trough a $Format array. To learn more about this please read the Format array guide.
Calling this function
drawSplitPath($Object,$Values,$Format);Where : Object is reference to a pImage object.
Values is reference to a pData object.
Format is an array containing the drawing parameters of the chart. Customisation array - Tune up your chart! It is possible to customize the splitted path chart rendering by playing with this array. Providing a detailled configuration is not mandatory. You can specify if the vertical spacing between two path with Spacing.
You can specify the text padding with TextPadding.
You can specify the text position with TextPos
You can specify the force of the wave with Force (default is 70)
You can specify the number of segments with Segment (default is 15)
You can use the Surrounding option to define the border color. This value will be added to the R,G,B factors to define the border color. The text position (TextPos) can be : TEXT_POS_TOP, this will put the path legend on top of the curve.
TEXT_POS_RIGHT, this will put the path legent at the right side. Sample script 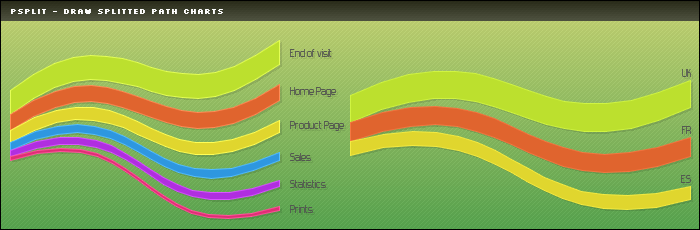
 /* pChart library inclusions */
 include("../class/pData.class.php");
 include("../class/pDraw.class.php");
 include("../class/pSplit.class.php");
 include("../class/pImage.class.php");

 /* Create the pChart object */
 $myPicture = new pImage(700,230);

 /* Draw the background */
 $Settings = array("R"=>170, "G"=>183, "B"=>87, "Dash"=>1, "DashR"=>190, "DashG"=>203, "DashB"=>107);
 $myPicture->drawFilledRectangle(0,0,700,230,$Settings);

 /* Overlay with a gradient */
 $Settings = array("StartR"=>219, "StartG"=>231, "StartB"=>139, "EndR"=>1, "EndG"=>138, "EndB"=>68, "Alpha"=>50);
 $myPicture->drawGradientArea(0,0,700,230,DIRECTION_VERTICAL,$Settings);
 $myPicture->drawGradientArea(0,0,700,20,DIRECTION_VERTICAL,array("StartR"=>0,"StartG"=>0,"StartB"=>0,"EndR"=>50,"EndG"=>50,"EndB"=>50,"Alpha"=>80));

 /* Add a border to the picture */
 $myPicture->drawRectangle(0,0,699,229,array("R"=>0,"G"=>0,"B"=>0));

 /* Write the picture title */
 $myPicture->setFontProperties(array("FontName"=>"../fonts/Silkscreen.ttf","FontSize"=>6));
 $myPicture->drawText(10,13,"pSplit - Draw splitted path charts",array("R"=>255,"G"=>255,"B"=>255));

 /* Set the default font properties */
 $myPicture->setFontProperties(array("FontName"=>"../fonts/Forgotte.ttf","FontSize"=>10,"R"=>80,"G"=>80,"B"=>80));

 /* Enable shadow computing */
 $myPicture->setShadow(TRUE,array("X"=>2,"Y"=>2,"R"=>0,"G"=>0,"B"=>0,"Alpha"=>10));

 /* Create and populate the pData object */
 $MyData = new pData();
 $MyData->addPoints(array(30,20,15,10,8,4),"Score");
 $MyData->addPoints(array("End of visit","Home Page","Product Page","Sales","Statistics","Prints"),"Labels");
 $MyData->setAbscissa("Labels");

 /* Create the pSplit object */
 $SplitChart = new pSplit();

 /* Draw the split chart */
 $Settings = array("TextPos"=>TEXT_POS_RIGHT,"TextPadding"=>10,"Spacing"=>20,"Surrounding"=>40);
 $myPicture->setGraphArea(10,20,340,230);
 $SplitChart->drawSplitPath($myPicture,$MyData,$Settings);

 /* Create and populate the pData object */
 $MyData2 = new pData();
 $MyData2->addPoints(array(30,20,15),"Score");
 $MyData2->addPoints(array("UK","FR","ES"),"Labels");
 $MyData2->setAbscissa("Labels");

 /* Draw the split chart */
 $Settings = array("TextPadding"=>4,"Spacing"=>30,"Surrounding"=>20);
 $myPicture->setGraphArea(350,50,690,200);
 $SplitChart->drawSplitPath($myPicture,$MyData2,$Settings);

 /* Render the picture (choose the best way) */
 $myPicture->autoOutput("pictures/example.split.png");
© Copyrights
Components used on this web site : Famfamfam icons has been made by Mark James, Rounded corners lite has been coded by Cameron Cooke and Tim Hutchison, SyntaxHighlighter has
been written by Alex Gorbatchev. pChart and this web site have been created by Jean-Damien POGOLOTTI. This documentation contains 185 pages and 56 comments. 415 users have registered.
This page has been rendered in 0,01 seconds. Wiki revision 1.37.
|