|
Language Reference » Dataset functions » setSerieShape
|
|
Latest updates
Toolbox
Google AdSense
|
setSerieShape - Associate a shape to a given serie This function allows you to associate a shape to a given serie. A bunch of internal shapes are already defines (including circle, square and triangles). We may extend this to new shapes later on. Calling this function
setSerieShape($Series,$Shape=SERIE_SHAPE_FILLEDCIRCLE); Where : Series is the name of the serie. (or an array of names)
Shape is the name of a predefined shape. The following shape are internally defined : SERIE_SHAPE_FILLEDCIRCLE to associate a filled circle.
SERIE_SHAPE_FILLEDTRIANGLE to associate a filled triangle.
SERIE_SHAPE_FILLEDSQUARE to associate a filled square.
SERIE_SHAPE_FILLEDDIAMOND to associate a filled diamond.
SERIE_SHAPE_CIRCLE to associate a circle.
SERIE_SHAPE_TRIANGLE to associate a triangle.
SERIE_SHAPE_SQUARE to associate a square.
SERIE_SHAPE_DIAMOND to associate a diamond. Sample script 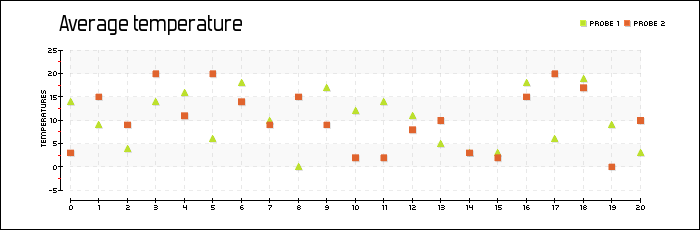
 /* pChart library inclusions */
 include("../class/pData.class.php");
 include("../class/pDraw.class.php");
 include("../class/pImage.class.php");

 /* Create and populate the pData object */
 $MyData = new pData();
 for($i=0;$i<=20;$i++) { $MyData->addPoints(rand(0,20),"Probe 1"); }
 for($i=0;$i<=20;$i++) { $MyData->addPoints(rand(0,20),"Probe 2"); }
 $MyData->setSerieShape("Probe 1",SERIE_SHAPE_FILLEDTRIANGLE);
 $MyData->setSerieShape("Probe 2",SERIE_SHAPE_FILLEDSQUARE);
 $MyData->setAxisName(0,"Temperatures");

 /* Create the pChart object */
 $myPicture = new pImage(700,230,$MyData);

 /* Turn of Antialiasing */
 $myPicture->Antialias = FALSE;

 /* Add a border to the picture */
 $myPicture->drawRectangle(0,0,699,229,array("R"=>0,"G"=>0,"B"=>0));

 /* Write the chart title */
 $myPicture->setFontProperties(array("FontName"=>"../fonts/Forgotte.ttf","FontSize"=>11));
 $myPicture->drawText(150,35,"Average temperature",array("FontSize"=>20,"Align"=>TEXT_ALIGN_BOTTOMMIDDLE));

 /* Set the default font */
 $myPicture->setFontProperties(array("FontName"=>"../fonts/pf_arma_five.ttf","FontSize"=>6));

 /* Define the chart area */
 $myPicture->setGraphArea(60,40,650,200);

 /* Draw the scale */
 $scaleSettings = array("XMargin"=>10,"YMargin"=>10,"Floating"=>TRUE,"GridR"=>200,"GridG"=>200,"GridB"=>200, "DrawSubTicks"=>TRUE,"CycleBackground"=>TRUE);
 $myPicture->drawScale($scaleSettings);

 /* Turn on Antialiasing */
 $myPicture->Antialias = TRUE;
 $myPicture->setShadow(TRUE,array("X"=>1,"Y"=>1,"R"=>0,"G"=>0,"B"=>0,"Alpha"=>10));

 /* Draw the line chart */
 $myPicture->drawPlotChart();

 /* Write the chart legend */
 $myPicture->drawLegend(580,20,array("Style"=>LEGEND_NOBORDER,"Mode"=>LEGEND_HORIZONTAL));

 /* Render the picture (choose the best way) */
 $myPicture->autoOutput("pictures/example.drawPlotChart.simple.png");
© Copyrights
Components used on this web site : Famfamfam icons has been made by Mark James, Rounded corners lite has been coded by Cameron Cooke and Tim Hutchison, SyntaxHighlighter has
been written by Alex Gorbatchev. pChart and this web site have been created by Jean-Damien POGOLOTTI. This documentation contains 185 pages and 56 comments. 415 users have registered.
This page has been rendered in 0,01 seconds. Wiki revision 1.37.
|