|
FAQ » Missing points
|
|
Latest updates
Toolbox
Google AdSense
|
Missing points handling pChart can support data series with missing points. Points that have an undefined values must be declared with the VOID class constant. By default the chart rendering will break on this values and continue again when enough consistent values are found again. You may want to have a chart continuity even in the case of missing values. To do so you can use the BreakVoid option.
The following parameters can be tunned : The size of the ticks can be set with VoidTicks.
The line color can be set with BreakR,BreakG,BreakB. Example 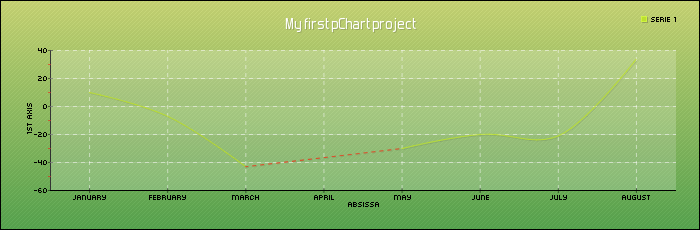 Let‘s assume the following dataset :
$myData = new pData();
$myData->addPoints(array(10,-7,-43,VOID,-30,-20,-21,34),"Serie1");
$myData->setSerieDescription("Serie1","Serie 1");
You can turn on the missing point processing this way :
$Config = array("BreakVoid"=>FALSE, "BreakR"=>234, "BreakG"=>55, "BreakB"=>26);
$myPicture->drawSplineChart($Config);
The missing points will be drawn with red lines (RGB 234,55,26).
© Copyrights
Components used on this web site : Famfamfam icons has been made by Mark James, Rounded corners lite has been coded by Cameron Cooke and Tim Hutchison, SyntaxHighlighter has
been written by Alex Gorbatchev. pChart and this web site have been created by Jean-Damien POGOLOTTI. This documentation contains 185 pages and 56 comments. 415 users have registered.
This page has been rendered in 0,01 seconds. Wiki revision 1.37.
|