|
Miscellaneous » Sandbox system
|
|
Latest updates
Toolbox
Google AdSense
|
Sandbox system In order to help you to design your own charts and to give you a fast overview of the pChart library functionnality you can use the sandbox script located in the examples/sandbox folder of the main library package. Those pages are written in PHP so you‘ll have to access them through your web server.
The sandbox can be a good starting point to discover the pChart library. We greatly invite you to take a look on it. System overview 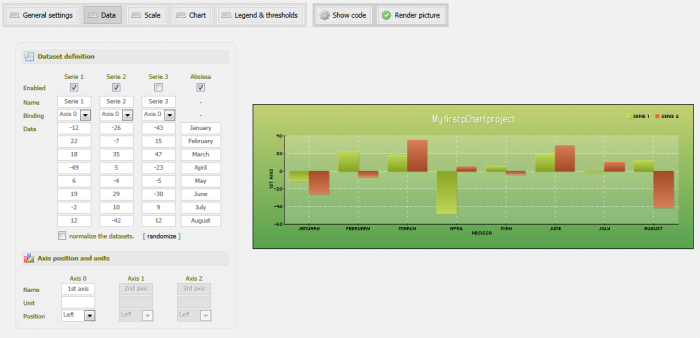 As of today the sandbox system allow you to create up to 3 data series containing a max of 8 values. You can bind your data series on 3 axis and play with all the core concepts of the pChart library : Dataset management
Classical charts
Scaling options
Legends layout
Threshold Clicking on the "Code" button will show you the source code of the generated graph.
© Copyrights
Components used on this web site : Famfamfam icons has been made by Mark James, Rounded corners lite has been coded by Cameron Cooke and Tim Hutchison, SyntaxHighlighter has
been written by Alex Gorbatchev. pChart and this web site have been created by Jean-Damien POGOLOTTI. This documentation contains 185 pages and 56 comments. 415 users have registered.
This page has been rendered in 0,01 seconds. Wiki revision 1.37.
|