|
Language Reference » Spring charts functions » drawSpring
|
|
Latest updates
Toolbox
Google AdSense
|
drawSpring - Draw a Spring graph This function allows will draw a spring graph. Parameters are given trough a $Settings array. To learn more about this please read the Format array guide.
Calling this function
drawSpring($Object,$Settings="");Where : Object is the reference to a pImage object. Settings array - Tune up your link! It is possible to customize the rendering with this array. You can specify the initial placement algorithm with Algorithm. (default is ALGORITHM_WEIGHTED)
The number of pass can be adjusted with Pass. (default is 50)
The number of retries can be set with Retries. (default is 10)
You can specify the text padding with TextPadding. (default is 4)
You can specify the attraction force with MagneticForceA. (default is 1.5)
You can specify the repulsion force with MagneticForceR. (default is 2)
You can draw the force vectors setting DrawVectors to TRUE.
You can draw the quiet zonesDrawQuietZone to TRUE. Following algorithms are allowed : ALGORITHM_RANDOM, nodes will be placed randomly.
ALGORITHM_WEIGHTED, node will be placed depending of their number of connections.
ALGORITHM_CIRCULAR, based on the weighted algorithm, this will limit the number of crossing links. Sample script 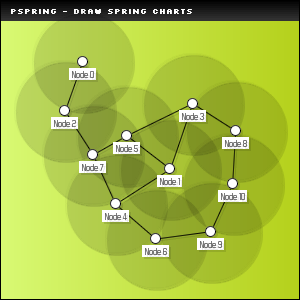
 /* pChart library inclusions */
 include("class/pData.class.php");
 include("class/pDraw.class.php");
 include("class/pSpring.class.php");
 include("class/pImage.class.php");

 /* Create the pChart object */
 $myPicture = new pImage(300,300);

 /* Background customization */
 $myPicture->drawGradientArea(0,0,300,300,DIRECTION_HORIZONTAL,array("StartR"=>217,"StartG"=>250,"StartB"=>116,"EndR"=>181,"EndG"=>209,"EndB"=>27,"Alpha"=>100));
 $myPicture->drawGradientArea(0,0,300,20,DIRECTION_VERTICAL,array("StartR"=>0,"StartG"=>0,"StartB"=>0,"EndR"=>50,"EndG"=>50,"EndB"=>50,"Alpha"=>100));
 $myPicture->drawRectangle(0,0,299,299,array("R"=>0,"G"=>0,"B"=>0));
 $myPicture->setFontProperties(array("FontName"=>"fonts/Silkscreen.ttf","FontSize"=>6));
 $myPicture->drawText(10,13,"pSpring - Draw spring charts",array("R"=>255,"G"=>255,"B"=>255));

 /* Prepare the graph area */
 $myPicture->setGraphArea(20,20,280,280);
 $myPicture->setFontProperties(array("FontName"=>"fonts/Forgotte.ttf","FontSize"=>9,"R"=>80,"G"=>80,"B"=>80));
 $myPicture->setShadow(TRUE,array("X"=>2,"Y"=>2,"R"=>0,"G"=>0,"B"=>0,"Alpha"=>10));

 /* Create the pSpring object */
 $SpringChart = new pSpring();

 /* Set the nodes default settings */
 $SpringChart->setNodeDefaults(array("FreeZone"=>50));

 /* Build random nodes & connections */
 for($i=0;$i<=10;$i++)
  {
   $Connections = "";
   for($j=0;$j<=rand(0,1);$j++)
    { $Connections[] = rand(0,10); }
   $SpringChart->addNode($i,array("Name"=>"Node ".$i,"Connections"=>$Connections));
  }

 /* Compute and draw the Spring Graph */
 $Result = $SpringChart->drawSpring($myPicture,array("DrawQuietZone"=>TRUE));

 /* Display the statistics */
 print_r($Result);

 /* Render the picture */
 $myPicture->Render("drawspring3.png");
© Copyrights
Components used on this web site : Famfamfam icons has been made by Mark James, Rounded corners lite has been coded by Cameron Cooke and Tim Hutchison, SyntaxHighlighter has
been written by Alex Gorbatchev. pChart and this web site have been created by Jean-Damien POGOLOTTI. This documentation contains 185 pages and 56 comments. 415 users have registered.
This page has been rendered in 0,01 seconds. Wiki revision 1.37.
|