|
Language Reference » Drawing functions » drawBezier
|
|
Latest updates
Toolbox
Google AdSense
|
drawBezier - Drawing bezier curve This function allows you to draw aliased bezier curves on your pictures. It is possible to tune the rendering by playing with the $Format array. To learn more about this please read the Format array guide. A bezier curve (within pChart) is defined by a starting point, and ending point and two control points. It can be pretty tricky to determine how to calculate the position of the control points, the Spline function is using simple trigonometric concepts to calculate it automatically for best rendering.This function is used internally by the drawSpline function to draw complex structures.
Calling this function
drawBezier($X1,$Y1,$X2,$Y2,$Xv1,$Yv1,$Xv2,$Yv2,$Format="");Where : X1,Y1 are the coordinate of the starting point.
X2,Y2 are the coordinate of the ending point.
Xv1,Yv1 are the coordinate of the 1st force vector.
Xv2,Yv2 are the coordinate of the 2nd force vector.
Format is an array containing the drawing parameters of the pixel. Customisation array - Tune up your curve! It is possible to customize the pixel rendering by playing with this array. Providing a detailled configuration is not mandatory, by default the curve will be drawn black with no transparency. The pixel color can be set with R, G, B.
The alpha transparency factor can be set with Alpha.
If you want to display the control points, turn ShowControl to TRUE.
You can optionally provide the number of Segments that will compose the spline. It is recommended to not force this value, the best eye-candy / speed ratio is automatically computed based on the spline length.
You can draw dashed curves using the Ticks parameter. ..and the arrow settings : DrawArrow define if an arrow will be drawn at the end of the curve if set to TRUE.
ArrowSize is the size of the arrow. Set to 10 by default.
ArrowRatio is the ratio of the arrow head. Set to 0.5 by default.
ArrowTwoHeads define if an arrow will also be drawn at the beginning of the curve if set to TRUE. Sample script 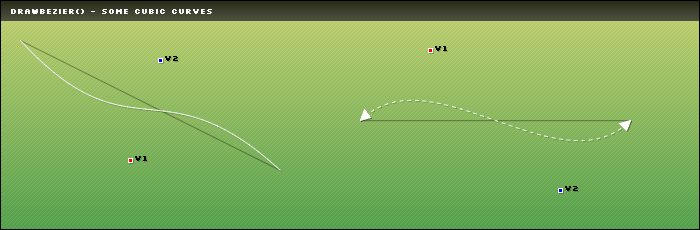
 /* Enable shadow support on a (+1,+1) basis */
 $myPicture->setShadow(TRUE,array("X"=>1,"Y"=>1,"R"=>0,"G"=>0,"B"=>0,"Alpha"=>20));

 /* We want to draw a white bezier curves with visible control points */
 $BezierSettings = array("R"=>255,"G"=>255,"B"=>255,"ShowControl"=>TRUE);
 $myPicture->drawBezier(20,40,280,170,130,160,160,60,$BezierSettings);

 /* We want to draw a dashed bezier curves with visible control points */
 /* Additionnaly we‘ll also draw arrows on both curve ends */
 $BezierSettings = array("R"=>255,"G"=>255,"B"=>255,"ShowControl"=>TRUE,"Ticks"=>4,"DrawArrow"=>TRUE,"ArrowTwoHeads"=>TRUE);
 $myPicture->drawBezier(360,120,630,120,430,50,560,190,$BezierSettings);
This will draw two bezier curves with visible control points. As the shadow support is enabled on line 2, the arrow will be surrounded by a small (+1,+1) shadow.
© Copyrights
Components used on this web site : Famfamfam icons has been made by Mark James, Rounded corners lite has been coded by Cameron Cooke and Tim Hutchison, SyntaxHighlighter has
been written by Alex Gorbatchev. pChart and this web site have been created by Jean-Damien POGOLOTTI. This documentation contains 185 pages and 56 comments. 415 users have registered.
This page has been rendered in 0,01 seconds. Wiki revision 1.37.
|