|
Language Reference » Spring charts functions » setNodeDefaults
|
|
Latest updates
Toolbox
Google AdSense
|
setNodeDefaults - Defines the default properties of the nodes This function allows you to specify the default properties of the nodes. Calling this function before defining the nodes allows you to apply default settings like color, shape,.. to all of them. Parameters are given trough a $Settings array. To learn more about this please read the Format array guide. Calling this function
setNodeDefaults ($Settings=""); No parameters required. Settings array - Tune up your nodes! It is possible to specify the following default settings with this array. Node color can be set with R, G, B.
Node border color can be set with BorderR, BorderG, BorderB.
Surrounding color can be set with Surrounding.
Label background color can be set with BackgroundR,BackgroundRG,BackgroundB.
Shape can be set with Shape. (see below)
Size can be set with Shape.
Free zone can be set with FreeZone. Following shapes types are allowed : NODE_SHAPE_CIRCLE, this will draw circular nodes.
NODE_SHAPE_SQUARE, this will draw box nodes.
NODE_SHAPE_TRIANGLE, this will draw triangular nodes. Sample script 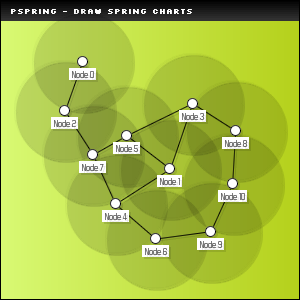
 /* pChart library inclusions */
 include("class/pData.class.php");
 include("class/pDraw.class.php");
 include("class/pSpring.class.php");
 include("class/pImage.class.php");

 /* Create the pChart object */
 $myPicture = new pImage(300,300);

 /* Background customization */
 $myPicture->drawGradientArea(0,0,300,300,DIRECTION_HORIZONTAL,array("StartR"=>217,"StartG"=>250,"StartB"=>116,"EndR"=>181,"EndG"=>209,"EndB"=>27,"Alpha"=>100));
 $myPicture->drawGradientArea(0,0,300,20,DIRECTION_VERTICAL,array("StartR"=>0,"StartG"=>0,"StartB"=>0,"EndR"=>50,"EndG"=>50,"EndB"=>50,"Alpha"=>100));
 $myPicture->drawRectangle(0,0,299,299,array("R"=>0,"G"=>0,"B"=>0));
 $myPicture->setFontProperties(array("FontName"=>"fonts/Silkscreen.ttf","FontSize"=>6));
 $myPicture->drawText(10,13,"pSpring - Draw spring charts",array("R"=>255,"G"=>255,"B"=>255));

 /* Prepare the graph area */
 $myPicture->setGraphArea(20,20,280,280);
 $myPicture->setFontProperties(array("FontName"=>"fonts/Forgotte.ttf","FontSize"=>9,"R"=>80,"G"=>80,"B"=>80));
 $myPicture->setShadow(TRUE,array("X"=>2,"Y"=>2,"R"=>0,"G"=>0,"B"=>0,"Alpha"=>10));

 /* Create the pSpring object */
 $SpringChart = new pSpring();

 /* Set the nodes default settings */
 $SpringChart->setNodeDefaults(array("FreeZone"=>50));

 /* Build random nodes & connections */
 for($i=0;$i<=10;$i++)
  {
   $Connections = "";
   for($j=0;$j<=rand(0,1);$j++)
    { $Connections[] = rand(0,10); }
   $SpringChart->addNode($i,array("Name"=>"Node ".$i,"Connections"=>$Connections));
  }

 /* Compute and draw the Spring Graph */
 $Result = $SpringChart->drawSpring($myPicture,array("DrawQuietZone"=>TRUE));

 /* Display the statistics */
 print_r($Result);

 /* Render the picture */
 $myPicture->Render("drawspring3.png");
© Copyrights
Components used on this web site : Famfamfam icons has been made by Mark James, Rounded corners lite has been coded by Cameron Cooke and Tim Hutchison, SyntaxHighlighter has
been written by Alex Gorbatchev. pChart and this web site have been created by Jean-Damien POGOLOTTI. This documentation contains 185 pages and 56 comments. 415 users have registered.
This page has been rendered in 0,01 seconds. Wiki revision 1.37.
|