|
Language Reference » Scatter chart » drawScatterThresholdArea
|
|
Latest updates
Toolbox
Google AdSense
|
drawScatterThresholdArea - Draw an area between two threshold This function will draw an area between two threshold. Using areas can help you to highlight specific values. It is possible to tune the rendering by playing with the $Format array. To learn more about this please read the Format array guide.
Calling this function
drawScatterThresholdArea($Value1,$Value2,$Format="");Where : Value1 is the value of the 1st threshold.
Value2 is the value of the 2nd threshold.
Format is an array containing the drawing parameters of the area. This function returns an array containing the Y position of the up & down boundaries of the area. Customisation array - Tune up your area! It is possible to customize the way your threshold will be rendered by playing with this array. Providing a detailled configuration is not mandatory, by default the line will be drawn dashed in red. You can specify which axis you‘ll use to compute the value position in the chart area AxisID
You can specify the filled area color using R,G,B.
You can specify the filled area alpha factor using Alpha.
You can draw the area bordes setting Border to TRUE or FALSE.
You can specify the border color using BorderR,BorderG,BorderB.
You can specify the border area alpha factor using BorderAlpha.
You can specify the border tick width with BorderTicks.
You can specify if the threshold will reach the axis bar even if margin are defined setting NoMargin to TRUE.
You can specify a text that will be written in the area with AreaName
Sample script 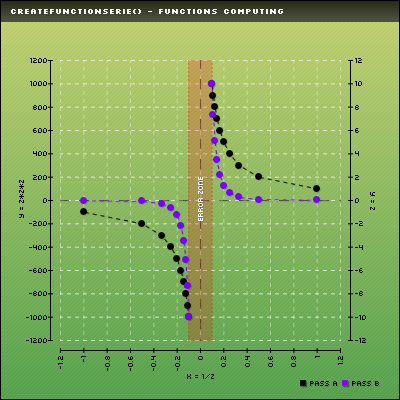
 /* pChart library inclusions */
 include("../class/pData.class.php");
 include("../class/pDraw.class.php");
 include("../class/pImage.class.php");
 include("../class/pScatter.class.php");

 /* Create the pData object */
 $myData = new pData();

 /* Create the X axis and the binded series */
 $myData->createFunctionSerie("X","1/z",array("MinX"=>-10,"MaxX"=>10,"XStep"=>1));
 $myData->setAxisName(0,"x = 1/z");
 $myData->setAxisXY(0,AXIS_X);
 $myData->setAxisPosition(0,AXIS_POSITION_BOTTOM);

 /* Create the Y axis */
 $myData->createFunctionSerie("Y","z",array("MinX"=>-10,"MaxX"=>10,"XStep"=>1));
 $myData->setSerieOnAxis("Y",1);
 $myData->setAxisName(1,"y = z");
 $myData->setAxisXY(1,AXIS_Y);
 $myData->setAxisPosition(1,AXIS_POSITION_RIGHT);

 /* Create the Y axis */
 $myData->createFunctionSerie("Y2","z*z*z",array("MinX"=>-10,"MaxX"=>10,"XStep"=>1));
 $myData->setSerieOnAxis("Y2",2);
 $myData->setAxisName(2,"y = z*z*z");
 $myData->setAxisXY(2,AXIS_Y);
 $myData->setAxisPosition(2,AXIS_POSITION_LEFT);

 /* Create the 1st scatter chart binding */
 $myData->setScatterSerie("X","Y",0);
 $myData->setScatterSerieDescription(0,"Pass A");
 $myData->setScatterSerieTicks(0,4);
 $myData->setScatterSerieColor(0,array("R"=>0,"G"=>0,"B"=>0));

 /* Create the 2nd scatter chart binding */
 $myData->setScatterSerie("X","Y2",1);
 $myData->setScatterSerieDescription(1,"Pass B");
 $myData->setScatterSerieTicks(1,4);
 $myData->setScatterSerieColor(1,array("R"=>120,"G"=>0,"B"=>255));

 /* Create the pChart object */
 $myPicture = new pImage(400,400,$myData);

 /* Draw the background */
 $Settings = array("R"=>170, "G"=>183, "B"=>87, "Dash"=>1, "DashR"=>190, "DashG"=>203, "DashB"=>107);
 $myPicture->drawFilledRectangle(0,0,400,400,$Settings);

 /* Overlay with a gradient */
 $Settings = array("StartR"=>219, "StartG"=>231, "StartB"=>139, "EndR"=>1, "EndG"=>138, "EndB"=>68, "Alpha"=>50);
 $myPicture->drawGradientArea(0,0,400,400,DIRECTION_VERTICAL,$Settings);
 $myPicture->drawGradientArea(0,0,400,20,DIRECTION_VERTICAL,array("StartR"=>0,"StartG"=>0,"StartB"=>0, "EndR"=>50,"EndG"=>50,"EndB"=>50,"Alpha"=>80));

 /* Write the picture title */
 $myPicture->setFontProperties(array("FontName"=>"../fonts/Silkscreen.ttf","FontSize"=>6));
 $myPicture->drawText(10,13,"createFunctionSerie() - Functions computing",array("R"=>255,"G"=>255,"B"=>255));

 /* Add a border to the picture */
 $myPicture->drawRectangle(0,0,399,399,array("R"=>0,"G"=>0,"B"=>0));
 /* Set the default font */
 $myPicture->setFontProperties(array("FontName"=>"../fonts/pf_arma_five.ttf","FontSize"=>6));

 /* Set the graph area */
 $myPicture->setGraphArea(50,50,350,350);

 /* Create the Scatter chart object */
 $myScatter = new pScatter($myPicture,$myData);

 /* Draw the scale */
 $myScatter->drawScatterScale(array("XMargin"=>10,"YMargin"=>10,"Floating"=>TRUE));

 /* Turn on shadow computing */
 $myPicture->setShadow(TRUE,array("X"=>1,"Y"=>1,"R"=>0,"G"=>0,"B"=>0,"Alpha"=>10));

 /* Draw the 0/0 lines */
 $myScatter->drawScatterThreshold(0,array("AxisID"=>0,"R"=>0,"G"=>0,"B"=>0,"Ticks"=>10));
 $myScatter->drawScatterThreshold(0,array("AxisID"=>1,"R"=>0,"G"=>0,"B"=>0,"Ticks"=>10));

 /* Draw a treshold area */
 $myScatter->drawScatterThresholdArea(-0.1,0.1,array("AreaName"=>"Error zone"));

 /* Draw a scatter plot chart */
 $myScatter->drawScatterLineChart();
 $myScatter->drawScatterPlotChart();

 /* Draw the legend */
 $myScatter->drawScatterLegend(300,380,array("Mode"=>LEGEND_HORIZONTAL,"Style"=>LEGEND_NOBORDER));

 /* Render the picture (choose the best way) */
 $myPicture->autoOutput("pictures/example.createFunctionSerie.scatter.png");
© Copyrights
Components used on this web site : Famfamfam icons has been made by Mark James, Rounded corners lite has been coded by Cameron Cooke and Tim Hutchison, SyntaxHighlighter has
been written by Alex Gorbatchev. pChart and this web site have been created by Jean-Damien POGOLOTTI. This documentation contains 185 pages and 56 comments. 415 users have registered.
This page has been rendered in 0,01 seconds. Wiki revision 1.37.
|