|
Language Reference » Indicators » draw
|
|
Latest updates
Toolbox
Google AdSense
|
draw - Draw an indicator This function allows you to draw an indicator. All the drawing parameters are given trough a $Format array. To learn more about this please read the Format array guide. Calling this function
draw($X,$Y,$Width,$Height,$Format="");Where : X,Y is the top left coordinates of the indicator.
Width is the width of the indicator.
Height is the heigh tof the indicator.
Format is an array containing the drawing parameters of the chart. Customisation array - Tune up your chart! It is possible to customize the rendering by playing with this array. Providing a detailled configuration is not mandatory. You‘ll see below a representation of all the customization possible : You can specify the space between two slices with SectionsMargin.
You can specify if you want to draw the left arrow head setting DrawLeftHead to TRUE.
You can specify if you want to draw the right arrow head setting DrawRightHead to TRUE.
You can specify the size of the arrow head(s) with HeadSize.
You can set the padding distance of the labels with TextPadding.
You can set the color of the captions with +/- factor based on the slice color with CaptionColorFactor.
..or you can set the color of the captions with CaptionR,CaptionG,CaptionB,CaptionAlpha.
You can set the color of the sub captions with +/- factor based on the slice color with SubCaptionColorFactor.
..or you can set the color of the captions with SubCaptionR,SubCaptionG,SubCaptionB,SubCaptionAlpha.
You can set the font used to write the captions with CaptionFontName.
You can set the size of the font used to write the captions with CaptionFontSize.
You can set the font used to write the values with ValueFontName.
You can set the size of the font used to write the values with ValueFontSize.
You can append an unit to the written values with Unit. You can define the place the captions will be written with CaptionPosition : INDICATOR_CAPTION_INSIDE to write the captions inside the slices.
INDICATOR_CAPTION_BOTTOM to write the captions bellow the slices. You can define the way the captions will be written with CaptionLayout : INDICATOR_CAPTION_DEFAULT to write only the slice name.
INDICATOR_CAPTION_EXTENDED to write the slice name and limits. You can specify the way the values will be written with ValueDisplay : INDICATOR_VALUE_BUBBLE to write the values inside bubbles.
INDICATOR_VALUE_LABEL to write the values inside caption boxes. The indicator sections must be given through an array called IndicatorSections that defines for each slices : the start value, the end value, the caption and the color.
 $IndicatorSections   = "";
 $IndicatorSections[] = array("Start"=>0,"End"=>199,"Caption"=>"Low","R"=>0,"G"=>142,"B"=>176);
 $IndicatorSections[] = array("Start"=>200,"End"=>239,"Caption"=>"Moderate","R"=>108,"G"=>157,"B"=>49);
 $IndicatorSections[] = array("Start"=>240,"End"=>300,"Caption"=>"High","R"=>157,"G"=>140,"B"=>49);
Finally, you need to give the value(s) that will be drawn through the Values array. Sample script #1 
 /* pChart library inclusions */
 include("../class/pData.class.php");
 include("../class/pDraw.class.php");
 include("../class/pImage.class.php");
 include("../class/pIndicator.class.php");

 /* Create and populate the pData object */
 $MyData = new pData();
 $MyData->addPoints(array(4,12,15,8,5,-5),"Probe 1");
 $MyData->addPoints(array(7,2,4,14,8,3),"Probe 2");
 $MyData->setAxisName(0,"Temperatures");
 $MyData->setAxisUnit(0,"°C");
 $MyData->addPoints(array("Jan","Feb","Mar","Apr","May","Jun"),"Labels");
 $MyData->setSerieDescription("Labels","Months");
 $MyData->setAbscissa("Labels");

 /* Create the pChart object */
 $myPicture = new pImage(700,230,$MyData);

 /* Draw the background */
 $Settings = array("R"=>170, "G"=>183, "B"=>87, "Dash"=>1, "DashR"=>190, "DashG"=>203, "DashB"=>107);
 $myPicture->drawFilledRectangle(0,0,700,230,$Settings);

 /* Overlay with a gradient */
 $Settings = array("StartR"=>219, "StartG"=>231, "StartB"=>139, "EndR"=>1, "EndG"=>138, "EndB"=>68, "Alpha"=>50);
 $myPicture->drawGradientArea(0,0,700,230,DIRECTION_VERTICAL,$Settings);
 $myPicture->drawGradientArea(0,0,700,20,DIRECTION_VERTICAL,array("StartR"=>0,"StartG"=>0,"StartB"=>0,"EndR"=>50,"EndG"=>50,"EndB"=>50,"Alpha"=>80));

 /* Add a border to the picture */
 $myPicture->drawRectangle(0,0,699,229,array("R"=>0,"G"=>0,"B"=>0));

 /* Write the picture title */
 $myPicture->setFontProperties(array("FontName"=>"../fonts/Silkscreen.ttf","FontSize"=>6));
 $myPicture->drawText(10,13,"drawIndicator() - Create nice looking indicators",array("R"=>255,"G"=>255,"B"=>255));

 /* Create the pIndicator object */
 $Indicator = new pIndicator($myPicture);

 $myPicture->setFontProperties(array("FontName"=>"../fonts/pf_arma_five.ttf","FontSize"=>6));

 /* Define the indicator sections */
 $IndicatorSections   = "";
 $IndicatorSections[] = array("Start"=>0,"End"=>199,"Caption"=>"Low","R"=>0,"G"=>142,"B"=>176);
 $IndicatorSections[] = array("Start"=>200,"End"=>239,"Caption"=>"Moderate","R"=>108,"G"=>157,"B"=>49);
 $IndicatorSections[] = array("Start"=>240,"End"=>300,"Caption"=>"High","R"=>157,"G"=>140,"B"=>49);

 /* Draw the 1st indicator */
 $IndicatorSettings = array("Values"=>array(20,230),"ValueFontName"=>"../fonts/Forgotte.ttf","ValueFontSize"=>15, "IndicatorSections"=>$IndicatorSections,"SubCaptionColorFactor"=>-40);
 $Indicator->draw(80,50,550,50,$IndicatorSettings);

 /* Define the indicator sections */
 $IndicatorSections   = "";
 $IndicatorSections[] = array("Start"=>0,"End"=>99,"Caption"=>"Low","R"=>135,"G"=>49,"B"=>15);
 $IndicatorSections[] = array("Start"=>100,"End"=>119,"Caption"=>"Borderline","R"=>183,"G"=>62,"B"=>15);
 $IndicatorSections[] = array("Start"=>120,"End"=>220,"Caption"=>"High","R"=>226,"G"=>74,"B"=>14);

 /* Draw the 2nd indicator */
 $IndicatorSettings = array("Values"=>array(100,201),"CaptionPosition"=>INDICATOR_CAPTION_BOTTOM,"CaptionR"=>0, "CaptionG"=>0,"CaptionB"=>0,"DrawLeftHead"=>FALSE, "ValueDisplay"=>INDICATOR_VALUE_LABEL,"ValueFontName"=>"../fonts/Forgotte.ttf", "ValueFontSize"=>15,"IndicatorSections"=>$IndicatorSections);
 $Indicator->draw(80,160,550,30,$IndicatorSettings);

 /* Render the picture (choose the best way) */
 $myPicture->autoOutput("pictures/example.drawIndicator.png");
Sample script #2 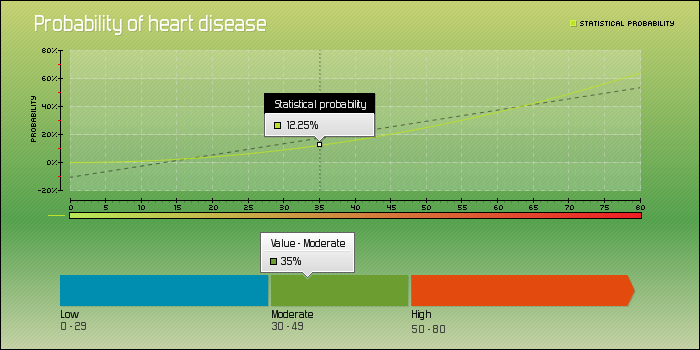
 /* pChart library inclusions */
 include("../class/pData.class.php");
 include("../class/pDraw.class.php");
 include("../class/pImage.class.php");
 include("../class/pIndicator.class.php");

 /* Create and populate the pData object */
 $MyData = new pData();
 for($i=0;$i<=80;$i++) { $MyData->addPoints(($i/10)*($i/10),"Statistical probability"); }
 $MyData->setAxisName(0,"Probability");
 $MyData->setAxisUnit(0,"%");

 /* Create the pChart object */
 $myPicture = new pImage(700,350,$MyData);

 /* Turn of Antialiasing */
 $myPicture->Antialias = FALSE;

 /* Draw the background */
 $Settings = array("R"=>170, "G"=>183, "B"=>87, "Dash"=>1, "DashR"=>190, "DashG"=>203, "DashB"=>107);
 $myPicture->drawFilledRectangle(0,0,700,350,$Settings);

 /* Overlay with a gradient */
 $Settings = array("StartR"=>219, "StartG"=>231, "StartB"=>139, "EndR"=>1, "EndG"=>138, "EndB"=>68, "Alpha"=>50);
 $myPicture->drawGradientArea(0,0,700,220,DIRECTION_VERTICAL,$Settings);
 $Settings = array("StartR"=>1, "StartG"=>138, "StartB"=>68, "EndR"=>219, "EndG"=>231, "EndB"=>239, "Alpha"=>50);
 $myPicture->drawGradientArea(0,222,700,350,DIRECTION_VERTICAL,$Settings);

 /* Add a border to the picture */
 $myPicture->drawRectangle(0,0,699,349,array("R"=>0,"G"=>0,"B"=>0));

 /* Set the default font */
 $myPicture->setFontProperties(array("FontName"=>"../fonts/pf_arma_five.ttf","FontSize"=>6));

 /* Define the chart area */
 $myPicture->setGraphArea(60,40,650,200);

 /* Draw the scale */
 $scaleSettings = array("XMargin"=>10,"YMargin"=>10,"Floating"=>TRUE,"LabelSkip"=>4,"GridR"=>220, "GridG"=>220,"GridB"=>220,"DrawSubTicks"=>TRUE,"CycleBackground"=>TRUE);
 $myPicture->drawScale($scaleSettings);

 /* Turn on Antialiasing */
 $myPicture->Antialias = TRUE;

 /* Draw the line of best fit */
 $myPicture->drawBestFit(array("Ticks"=>4,"Alpha"=>50,"R"=>0,"G"=>0,"B"=>0));

 /* Draw the line chart */
 $myPicture->drawLineChart();

 /* Draw the series derivative graph */
 $myPicture->drawDerivative(array("ShadedSlopeBox"=>TRUE,"CaptionLine"=>TRUE));

 /* Write the chart legend */
 $myPicture->drawLegend(570,20,array("Style"=>LEGEND_NOBORDER,"Mode"=>LEGEND_HORIZONTAL));

 /* Set the default font & shadow settings */
 $myPicture->setShadow(TRUE,array("X"=>1,"Y"=>1,"R"=>0,"G"=>0,"B"=>0,"Alpha"=>10));
 $myPicture->setFontProperties(array("FontName"=>"../fonts/Forgotte.ttf","FontSize"=>11));

 /* Write the chart title */
 $myPicture->setFontProperties(array("FontName"=>"../fonts/Forgotte.ttf","FontSize"=>11));
 $myPicture->drawText(150,35,"Probability of heart disease",array("FontSize"=>20,"Align"=>TEXT_ALIGN_BOTTOMMIDDLE,"R"=>255,"G"=>255,"B"=>255));

 /* Write a label over the chart */
 $LabelSettings = array("DrawVerticalLine"=>TRUE,"TitleMode"=>LABEL_TITLE_BACKGROUND,"TitleR"=>255,"TitleG"=>255,"TitleB"=>255);
 $myPicture->writeLabel("Statistical probability",35,$LabelSettings);

 /* Create the pIndicator object */
 $Indicator = new pIndicator($myPicture);

 /* Define the indicator sections */
 $IndicatorSections   = "";
 $IndicatorSections[] = array("Start"=>0,"End"=>29,"Caption"=>"Low","R"=>0,"G"=>142,"B"=>176);
 $IndicatorSections[] = array("Start"=>30,"End"=>49,"Caption"=>"Moderate","R"=>108,"G"=>157,"B"=>49);
 $IndicatorSections[] = array("Start"=>50,"End"=>80,"Caption"=>"High","R"=>226,"G"=>74,"B"=>14);

 /* Draw the 2nd indicator */
 $IndicatorSettings = array("Values"=>35,"Unit"=>"%", "CaptionPosition"=>INDICATOR_CAPTION_BOTTOM, "CaptionR"=>0, "CaptionG"=>0,"CaptionB"=>0,"DrawLeftHead"=>FALSE,"ValueDisplay"=>INDICATOR_VALUE_LABEL, "ValueFontName"=>"../fonts/Forgotte.ttf", "ValueFontSize"=>15, "IndicatorSections"=>$IndicatorSections);
 $Indicator->draw(60,275,580,30,$IndicatorSettings);

 /* Render the picture (choose the best way) */
 $myPicture->autoOutput("pictures/example.mixed.png");
© Copyrights
Components used on this web site : Famfamfam icons has been made by Mark James, Rounded corners lite has been coded by Cameron Cooke and Tim Hutchison, SyntaxHighlighter has
been written by Alex Gorbatchev. pChart and this web site have been created by Jean-Damien POGOLOTTI. This documentation contains 185 pages and 56 comments. 415 users have registered.
This page has been rendered in 0,01 seconds. Wiki revision 1.37.
|