|
Language Reference » Spring charts functions » pSpring
|
|
Latest updates
Toolbox
Google AdSense
|
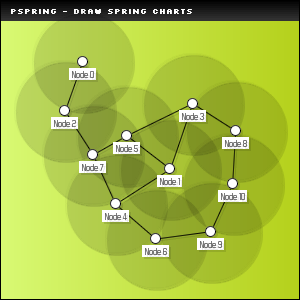
pSpring - Draw spring graphs This function allows you to create Spring Graphs. Force-based or force-directed algorithms are a class of algorithms for drawing graphs in an aesthetically pleasing way. Their purpose is to position the nodes of a graph in two dimensional or three dimensional space (not supported yet) so that all the edges are of more or less equal length and there are as few crossing edges as possible. The force-directed algorithms achieve this by assigning forces amongst the set of edges and the set of nodes; the most straightforward method is to assign forces as if the edges were springs (see Hooke‘s law) and the nodes were electrically charged particles (see Coulomb‘s law). The entire graph is then simulated as if it were a physical system. The forces are applied to the nodes, pulling them closer together or pushing them further apart. This is repeated iteratively until the system comes to an equilibrium state; i.e., their relative positions do not change anymore from one iteration to the next. At that moment, the graph is drawn. The physical interpretation of this equilibrium state is that all the forces are in mechanical equilibrium.
Calling this function
pSpring(); There is no parameters to give while creating this object. Sample script 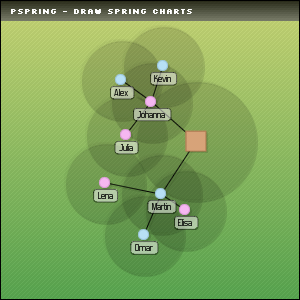

 /* pChart library inclusions */
 include("class/pData.class.php");
 include("class/pDraw.class.php");
 include("class/pSpring.class.php");
 include("class/pImage.class.php");

 /* Create the pChart object */
 $myPicture = new pImage(300,300);

 /* Create the background */
 $myPicture->drawGradientArea(0,0,300,300,DIRECTION_HORIZONTAL,array("StartR"=>217,"StartG"=>250,"StartB"=>116,"EndR"=>181,"EndG"=>209,"EndB"=>27,"Alpha"=>100));
 $myPicture->drawGradientArea(0,0,300,20,DIRECTION_VERTICAL,array("StartR"=>0,"StartG"=>0,"StartB"=>0,"EndR"=>50,"EndG"=>50,"EndB"=>50,"Alpha"=>100));
 $myPicture->drawRectangle(0,0,299,299,array("R"=>0,"G"=>0,"B"=>0));
 $myPicture->setFontProperties(array("FontName"=>"fonts/Silkscreen.ttf","FontSize"=>6));
 $myPicture->drawText(10,13,"pSpring - Draw spring charts",array("R"=>255,"G"=>255,"B"=>255));


 /* Define the charting area & stuff */
 $myPicture->setGraphArea(20,20,280,280);
 $myPicture->setFontProperties(array("FontName"=>"fonts/Forgotte.ttf","FontSize"=>9,"R"=>80,"G"=>80,"B"=>80));
 $myPicture->setShadow(TRUE,array("X"=>2,"Y"=>2,"R"=>0,"G"=>0,"B"=>0,"Alpha"=>10));

 /* Create the pSpring object */
 $SpringChart = new pSpring();

 /* Create some nodes and connections */
 $SpringChart->addNode(0,array("Shape"=>NODE_SHAPE_SQUARE,"FreeZone"=>60,"Size"=>20,"NodeType"=>NODE_TYPE_CENTRAL));
 $SpringChart->addNode(1,array("Connections"=>"0"));
 $SpringChart->addNode(2,array("Connections"=>"0"));
 $SpringChart->addNode(3,array("Shape"=>NODE_SHAPE_TRIANGLE,"Connections"=>"1"));
 $SpringChart->addNode(4,array("Shape"=>NODE_SHAPE_TRIANGLE,"Connections"=>"1"));
 $SpringChart->addNode(5,array("Shape"=>NODE_SHAPE_TRIANGLE,"Connections"=>"1"));
 $SpringChart->addNode(6,array("Connections"=>"2"));
 $SpringChart->addNode(7,array("Connections"=>"2"));
 $SpringChart->addNode(8,array("Connections"=>"2"));

 /* Define the nodes color */
 $SpringChart->setNodesColor(0,array("R"=>215,"G"=>163,"B"=>121,"BorderR"=>166,"BorderG"=>115,"BorderB"=>74));
 $SpringChart->setNodesColor(array(1,2),array("R"=>150,"G"=>215,"B"=>121,"Surrounding"=>-30));
 $SpringChart->setNodesColor(array(3,4,5),array("R"=>216,"G"=>166,"B"=>14,"Surrounding"=>-30));
 $SpringChart->setNodesColor(array(6,7,8),array("R"=>179,"G"=>121,"B"=>215,"Surrounding"=>-30));

 /* Customize some relations */
 $SpringChart->linkProperties(0,1,array("R"=>255,"G"=>0,"B"=>0,"Ticks"=>2));
 $SpringChart->linkProperties(0,2,array("R"=>255,"G"=>0,"B"=>0,"Ticks"=>2));

 /* Render the spring chart */
 $Result = $SpringChart->drawSpring($myPicture);
 print_r($Result);

 /* Render the picture */
 $myPicture->Render("drawspring.png");
This will create a drawspring.png file and print the algorithm statistics.
C:WebLibrary>php -q test-spring.php
Array
(
    [Pass] => 1
    [Conflicts] => 0
)
© Copyrights
Components used on this web site : Famfamfam icons has been made by Mark James, Rounded corners lite has been coded by Cameron Cooke and Tim Hutchison, SyntaxHighlighter has
been written by Alex Gorbatchev. pChart and this web site have been created by Jean-Damien POGOLOTTI. This documentation contains 185 pages and 56 comments. 415 users have registered.
This page has been rendered in 0,01 seconds. Wiki revision 1.37.
|