|
Language Reference » Drawing functions » drawDerivative
|
|
Latest updates
Toolbox
Google AdSense
|
drawDerivative - Drawing the slop factors of your data series Require pChart 2.0.13 This function allows you to draw the slope values of the data series with gradient areas. All the drawing parameters are given trough a $Format array. To learn more about this please read the Format array guide. Calling this function
drawDerivative($Format=NULL);Where : Format is an array containing the drawing parameters. Customisation array - Tune up your rendering! It is possible to customize the rendering by playing with this array. Providing a detailled configuration is not mandatory, by default the slopes will be rendered with solid patterns. The space between the bottom of your scale and the top of the derivative area can be set with Offset.
The space between two data series can be set with SerieSpacing.
The height of the slop area can be set with DerivativeHeight.
You can choose to draw a gradient pattern instead of a solid one setting ShadedSlopeBox to TRUE.
You can choose to draw a background color under the slope colored area setting DrawBackground to TRUE.
The color of the background area can be set with BackgroundR, BackgroundG, BackgroundB.
The alpha transparency factor of the background area can be set with BackgroundAlpha.
You can choose to draw a border around the slope colored area setting DrawBorder to TRUE.
The color of the border can be set with BorderR, BorderG, BorderB.
The alpha transparency factor of the border can be set with BorderAlpha. Caption area specifics parameters : You can choose if the serie caption will be written setting Caption to TRUE.
You can set the height of the serie caption box with CaptionHeight.
You can set the width of the serie caption box with CaptionWidth.
You can choose the space between the caption and the slope area with CaptionMargin.
You can choose if the caption will be represented as a line instead than a solid box setting CaptionLine to TRUE.
You can choose if the caption will be written in a box setting CaptionBox to TRUE.
The box border color can be adjusted with CaptionBorderR, CaptionBorderG, CaptionBorderB.
The box filling color can be adjusted with CaptionFillR, CaptionFillG, CaptionFillB, CaptionFillAlpha. Gradient area specifics parameters for positive slopes : The slop 0 factor color can be set with PositiveSlopeStartR, PositiveSlopeStartG, PositiveSlopeStartB.
The slop max factor color can be set with PositiveSlopeEndR, PositiveSlopeEndG, PositiveSlopeEndB. Gradient area specifics parameters for negative slopes : The slop 0 factor color can be set with NegativeSlopeStartR, NegativeSlopeStartG, NegativeSlopeStartB.
The slop max factor color can be set with NegativeSlopeEndR, NegativeSlopeEndG, NegativeSlopeEndB. Sample script #1 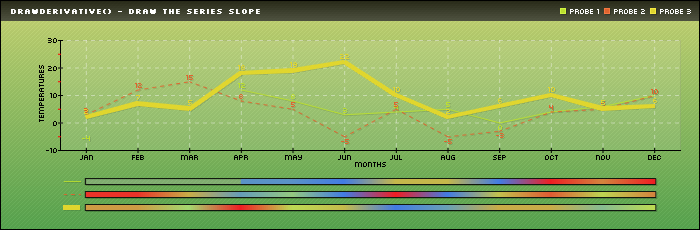
 /* pChart library inclusions */
 include("../class/pData.class.php");
 include("../class/pDraw.class.php");
 include("../class/pImage.class.php");

 /* Create and populate the pData object */
 $MyData = new pData();
 $MyData->addPoints(array(-4,VOID,VOID,12,8,3,4,5,0,4,6,10),"Probe 1");
 $MyData->addPoints(array(3,12,15,8,5,-5,5,-5,-3,4,5,10),"Probe 2");
 $MyData->addPoints(array(2,7,5,18,19,22,10,2,6,10,5,6),"Probe 3");
 $MyData->setSerieTicks("Probe 2",4);
 $MyData->setSerieWeight("Probe 3",2);
 $MyData->setAxisName(0,"Temperatures");
 $MyData->addPoints(array("Jan","Feb","Mar","Apr","May","Jun","Jul","Aug","Sep","Oct","Nov","Dec"),"Labels");
 $MyData->setSerieDescription("Labels","Months");
 $MyData->setAbscissa("Labels");

 /* Create the pChart object */
 $myPicture = new pImage(700,230,$MyData);

 /* Draw the background */
 $Settings = array("R"=>170, "G"=>183, "B"=>87, "Dash"=>1, "DashR"=>190, "DashG"=>203, "DashB"=>107);
 $myPicture->drawFilledRectangle(0,0,700,230,$Settings);

 /* Overlay with a gradient */
 $Settings = array("StartR"=>219, "StartG"=>231, "StartB"=>139, "EndR"=>1, "EndG"=>138, "EndB"=>68, "Alpha"=>50);
 $myPicture->drawGradientArea(0,0,700,230,DIRECTION_VERTICAL,$Settings);
 $myPicture->drawGradientArea(0,0,700,20,DIRECTION_VERTICAL,array("StartR"=>0,"StartG"=>0,"StartB"=>0,"EndR"=>50,"EndG"=>50,"EndB"=>50,"Alpha"=>80));

 /* Add a border to the picture */
 $myPicture->drawRectangle(0,0,699,229,array("R"=>0,"G"=>0,"B"=>0));

 /* Write the picture title */
 $myPicture->setFontProperties(array("FontName"=>"../fonts/Silkscreen.ttf","FontSize"=>6));
 $myPicture->drawText(10,13,"drawDerivative() - draw the series slope",array("R"=>255,"G"=>255,"B"=>255));

 /* Set the default font */
 $myPicture->setFontProperties(array("FontName"=>"../fonts/pf_arma_five.ttf","FontSize"=>6));

 /* Draw the scale and the 1st chart */
 $myPicture->setGraphArea(60,40,680,150);
 $myPicture->drawFilledRectangle(60,40,680,150,array("R"=>255,"G"=>255,"B"=>255,"Surrounding"=>-200,"Alpha"=>10));
 $myPicture->drawScale(array("DrawSubTicks"=>TRUE));
 $myPicture->setShadow(TRUE,array("X"=>1,"Y"=>1,"R"=>0,"G"=>0,"B"=>0,"Alpha"=>10));
 $myPicture->setFontProperties(array("FontName"=>"../fonts/pf_arma_five.ttf","FontSize"=>6));
 $myPicture->drawLineChart(array("DisplayValues"=>TRUE,"DisplayColor"=>DISPLAY_AUTO));

 /* Draw the series derivative graph */
 $myPicture->drawDerivative(array("ShadedSlopeBox"=>TRUE,"CaptionLine"=>TRUE));

 /* Write the chart legend */
 $myPicture->setFontProperties(array("R"=>255,"G"=>255,"B"=>255));
 $myPicture->drawLegend(560,8,array("Style"=>LEGEND_NOBORDER,"Mode"=>LEGEND_HORIZONTAL));

 /* Render the picture (choose the best way) */
 $myPicture->autoOutput("pictures/example.drawDerivative.png");
Sample script #2 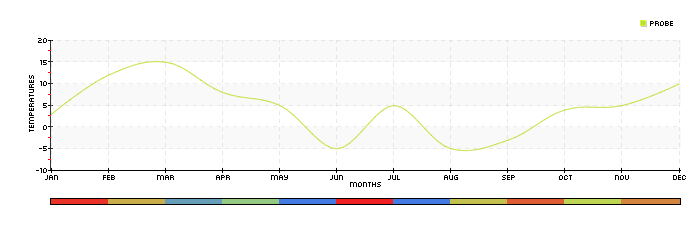
 /* pChart library inclusions */
 include("../class/pData.class.php");
 include("../class/pDraw.class.php");
 include("../class/pImage.class.php");

 /* Create and populate the pData object */
 $MyData = new pData();
 $MyData->addPoints(array(3,12,15,8,5,-5,5,-5,-3,4,5,10),"Probe");
 $MyData->setAxisName(0,"Temperatures");
 $MyData->addPoints(array("Jan","Feb","Mar","Apr","May","Jun","Jul","Aug","Sep","Oct","Nov","Dec"),"Labels");
 $MyData->setSerieDescription("Labels","Months");
 $MyData->setAbscissa("Labels");

 /* Create the pChart object */
 $myPicture = new pImage(700,230,$MyData);

 /* Turn of AAliasing */
 $myPicture->Antialias = FALSE;

 /* Set the default font */
 $myPicture->setFontProperties(array("R"=>0,"G"=>0,"B"=>0,"FontName"=>"../fonts/pf_arma_five.ttf","FontSize"=>6));

 /* Draw the scale and the 1st chart */
 $myPicture->setGraphArea(50,40,680,170);

 $scaleSettings = array("GridR"=>200,"GridG"=>200,"GridB"=>200,"DrawSubTicks"=>TRUE,"CycleBackground"=>TRUE,"XMargin"=>1);
 $myPicture->drawScale($scaleSettings);

 /* Draw the chart */
 $myPicture->Antialias = TRUE;
 $myPicture->drawSplineChart();
 $myPicture->Antialias = FALSE;

 /* Draw the series derivative graph */
 $myPicture->drawDerivative(array("Caption"=>FALSE));

 /* Write the chart legend */
 $myPicture->drawLegend(640,20,array("Style"=>LEGEND_NOBORDER,"Mode"=>LEGEND_HORIZONTAL));

 /* Render the picture (choose the best way) */
 $myPicture->autoOutput("pictures/example.drawDerivative.simple.png");
© Copyrights
Components used on this web site : Famfamfam icons has been made by Mark James, Rounded corners lite has been coded by Cameron Cooke and Tim Hutchison, SyntaxHighlighter has
been written by Alex Gorbatchev. pChart and this web site have been created by Jean-Damien POGOLOTTI. This documentation contains 185 pages and 56 comments. 415 users have registered.
This page has been rendered in 0,01 seconds. Wiki revision 1.37.
|