|
FAQ » Scaling methods
|
|
Latest updates
Toolbox
Google AdSense
|
Scaling methods Scaling is one of the most important topics when it comes to chart your data. pChart can handle many way of tuning the scaling algorithm so you‘ll be able to represent accurately your data with the best visual & readable result. Today the scaling engine can accept many parameters to allow you to stay in full-automatic, assisted or completely manual mode. Automatic computing (default) By default the scaling engine is configured to automatically compute the scale based on the overall MIN and MAX values of all the drawable dataseries. A "margin" value is added to the MIN/MAX boundaries to avoid that the chart will go outside the drawing area boundaries. Automatic computing of the scale occurs with the following modes : SCALE_MODE_FLOATING for min/max automatic scaling.
SCALE_MODE_ADDALL for stacked charts.
The example below shows what the automatic scale will produce with it‘s default configuration with a dataset of 24,-25,26,25,25 : 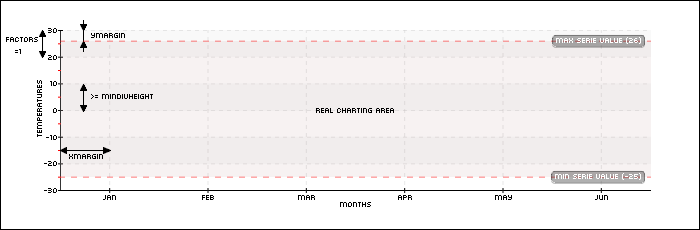
 /* pChart library inclusions */
 include("../class/pData.class.php");
 include("../class/pDraw.class.php");
 include("../class/pImage.class.php");

 /* Create and populate the pData object */
 $MyData = new pData();
 $MyData->addPoints(array(24,-25,26,25,25),"Temperature");
 $MyData->setAxisName(0,"Temperatures");
 $MyData->addPoints(array("Jan","Feb","Mar","Apr","May","Jun"),"Labels");
 $MyData->setSerieDescription("Labels","Months");
 $MyData->setAbscissa("Labels");

 /* Create the pChart object */
 $myPicture = new pImage(700,230,$MyData);

 /* Add a border to the picture */
 $myPicture->drawRectangle(0,0,699,229,array("R"=>0,"G"=>0,"B"=>0));

 /* Set the default font */
 $myPicture->setFontProperties(array("FontName"=>"../fonts/pf_arma_five.ttf","FontSize"=>6));

 /* Define the chart area */
 $myPicture->setGraphArea(60,30,650,190);

 /* Draw the basic scale */
 $scaleSettings = array("GridR"=>200,"GridG"=>200,"GridB"=>200,"DrawSubTicks"=>TRUE,"CycleBackground"=>TRUE);
 $myPicture->drawScale($scaleSettings);

 /* Render the picture (choose the best way) */
 $myPicture->autoOutput("pictures/example.png");
Assisted computing (Forced MIN = 0) In some cases, you may want to have the scale start to 0. As the automatic mode is computing the MIN value depending of your dataset and the margin option, you‘ll have to change the scaling mode to one of this two values : SCALE_MODE_START0 for fixed min to 0.
SCALE_MODE_ADDALL_START0 for stacked charts with a fixed min to 0.
The example below shows what the assisted scale will produce with a dataset of 24,4,26,25,25 : 
 /* pChart library inclusions */
 include("../class/pData.class.php");
 include("../class/pDraw.class.php");
 include("../class/pImage.class.php");

 /* Create and populate the pData object */
 $MyData = new pData();
 $MyData->addPoints(array(24,4,26,25,25),"Temperature");
 $MyData->setAxisName(0,"Temperatures");
 $MyData->addPoints(array("Jan","Feb","Mar","Apr","May","Jun"),"Labels");
 $MyData->setSerieDescription("Labels","Months");
 $MyData->setAbscissa("Labels");

 /* Create the pChart object */
 $myPicture = new pImage(700,230,$MyData);

 /* Add a border to the picture */
 $myPicture->drawRectangle(0,0,699,229,array("R"=>0,"G"=>0,"B"=>0));

 /* Set the default font */
 $myPicture->setFontProperties(array("FontName"=>"../fonts/pf_arma_five.ttf","FontSize"=>6));

 /* Define the chart area */
 $myPicture->setGraphArea(60,30,650,190);

 /* Draw the basic scale */
 $scaleSettings = array("GridR"=>200,"GridG"=>200,"GridB"=>200,"DrawSubTicks"=>TRUE,"CycleBackground"=>TRUE,"Mode"=>SCALE_MODE_START0);
 $myPicture->drawScale($scaleSettings);

 /* Render the picture (choose the best way) */
 $myPicture->autoOutput("pictures/example.a.scale.default.png");
Manual scale (Forced MIN and MAX) You may want to configure a static scale. In this mode you‘ll have to provide the MIN and MAX values of each X-Axis. These values are provided through an array. SCALE_MODE_MANUAL for complete manual min and max.
The example below shows what the manual scale will produce with fixed 0-100 boundaries. The dataset have no influence on the produced scale. 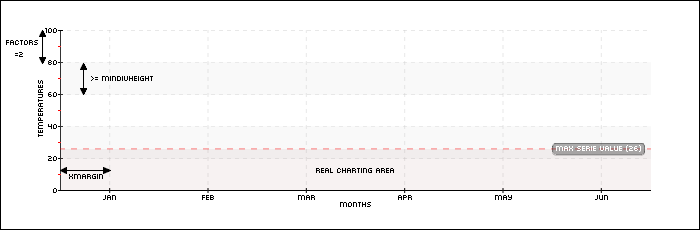
 /* pChart library inclusions */
 include("../class/pData.class.php");
 include("../class/pDraw.class.php");
 include("../class/pImage.class.php");

 /* Create and populate the pData object */
 $MyData = new pData();
 $MyData->addPoints(array(24,4,26,25,25),"Temperature");
 $MyData->setAxisName(0,"Temperatures");
 $MyData->addPoints(array("Jan","Feb","Mar","Apr","May","Jun"),"Labels");
 $MyData->setSerieDescription("Labels","Months");
 $MyData->setAbscissa("Labels");

 /* Create the pChart object */
 $myPicture = new pImage(700,230,$MyData);

 /* Add a border to the picture */
 $myPicture->drawRectangle(0,0,699,229,array("R"=>0,"G"=>0,"B"=>0));

 /* Set the default font */
 $myPicture->setFontProperties(array("FontName"=>"../fonts/pf_arma_five.ttf","FontSize"=>6));

 /* Define the chart area */
 $myPicture->setGraphArea(60,30,650,190);

 /* Draw the basic scale */
 $AxisBoundaries = array(0=>array("Min"=>0,"Max"=>100));
 $scaleSettings  = array("GridR"=>200,"GridG"=>200,"GridB"=>200,"DrawSubTicks"=>TRUE,"CycleBackground"=>TRUE,"Mode"=>SCALE_MODE_MANUAL, "ManualScale"=>$AxisBoundaries);
 $myPicture->drawScale($scaleSettings);

 /* Render the picture (choose the best way) */
 $myPicture->autoOutput("pictures/example.a.scale.default.png");
The Manual scale array is formatted this way when using two axis (formerly 0 and 1) :
$AxisBoundaries = array(0=>array("Min"=>0,"Max"=>100),1=>array("Min"=>10,"Max"=>20));
or also in a more readable way :
 $AxisBoundaries = "";
 $AxisBoundaries[0] = array("Min"=>0,"Max"=>100);
 $AxisBoundaries[1] = array("Min"=>10,"Max"=>20);
© Copyrights
Components used on this web site : Famfamfam icons has been made by Mark James, Rounded corners lite has been coded by Cameron Cooke and Tim Hutchison, SyntaxHighlighter has
been written by Alex Gorbatchev. pChart and this web site have been created by Jean-Damien POGOLOTTI. This documentation contains 185 pages and 56 comments. 415 users have registered.
This page has been rendered in 0,01 seconds. Wiki revision 1.37.
|