|
Language Reference » Stock charts » Stocks basics
|
|
Latest updates
Toolbox
Google AdSense
|
Stock charts basics Require pChart 2.0.11 The pStock extension allows you to create stock charts. As one data point is characterized by 4 values, you‘ll have to use your datasets in a different way than when you‘re drawing standard charts. Each data points is defined by the following states : The Max value as a the 1st boundary.
The Min value as a 2nd boundary.
The Open value.
The Close value. All this values have to be listed in dedicated datasets. You can also use an extra dataset to put your X axis labels. Exemple Let‘s assume that we got the data represented in the table bellow : 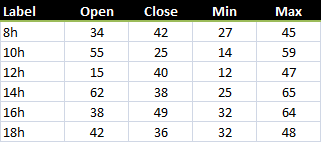 This will lead to the following declaration with the pData object structure :
 /* Create the pData object */
 $MyData = new pData();

 /* Populate the data series */
 $MyData->addPoints(array(34,55,15,62,38,42),"Open");
 $MyData->addPoints(array(42,25,40,38,49,36),"Close");
 $MyData->addPoints(array(27,14,12,25,32,32),"Min");
 $MyData->addPoints(array(45,59,47,65,64,48),"Max");

 /* Populate the X lables serie */
 $MyData->addPoints(array("8h","10h","12h","14h","16h","18h"),"Time");
 $MyData->setAbscissa("Time");
That can be charted this way :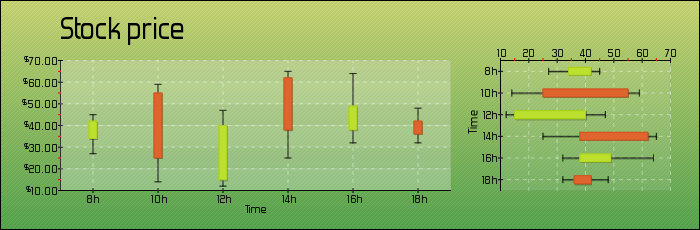
© Copyrights
Components used on this web site : Famfamfam icons has been made by Mark James, Rounded corners lite has been coded by Cameron Cooke and Tim Hutchison, SyntaxHighlighter has
been written by Alex Gorbatchev. pChart and this web site have been created by Jean-Damien POGOLOTTI. This documentation contains 185 pages and 56 comments. 415 users have registered.
This page has been rendered in 0,01 seconds. Wiki revision 1.37.
|