|
Language Reference » Dataset functions » setAxisName
|
|
Latest updates
Toolbox
Google AdSense
|
setAxisName - Define the name of one Y Axis This function allows you to set the name of one Y Axis. This name will be displayed when drawing the chart area. Values on this axis are automatically computed by the scaling algorithm.
Calling this function
setAxisName($AxisID,$Name); Where : AxisID is the ID of the axis we want to name.
Name is the name that will be put on the axis. Sample script #1 /* Create the pData object */ $MyData = new pData(); /* The default axis will be named "Samples" */ $MyData->setAxisName(0,"Samples"); Sample script #2 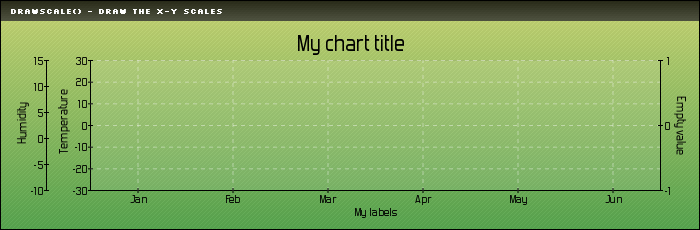
 $MyData = new pData();

 /* Prepare some nice data & axis config */
 $MyData->addPoints(array(24,-25,26,25,25),"Temperature");
 $MyData->addPoints(array(1,2,VOID,9,10),"Humidity 1");
 $MyData->addPoints(array(1,VOID,7,-9,0),"Humidity 2");
 $MyData->addPoints(array(-1,-1,-1,-1,-1),"Humidity 3");
 $MyData->addPoints(array(0,0,0,0,0),"Vide");
 $MyData->setSerieOnAxis("Temperature",0);
 $MyData->setSerieOnAxis("Humidity 1",1);
 $MyData->setSerieOnAxis("Humidity 2",1);
 $MyData->setSerieOnAxis("Humidity 3",1);
 $MyData->setSerieOnAxis("Vide",2);
 $MyData->setAxisPosition(2,AXIS_POSITION_RIGHT);
 $MyData->setAxisName(0,"Temperature");
 $MyData->setAxisName(1,"Humidity");
 $MyData->setAxisName(2,"Empty value");

 /* Bind a data serie to the X axis */
 $MyData->addPoints(array("Jan","Feb","Mar","Apr","May","Jun"),"Labels");
 $MyData->setSerieDescription("Labels","My labels");
 $MyData->setAbscissa("Labels");

 /* Define the graph area and do some makeup */
 $myPicture->setGraphArea(90,60,660,190);
 $myPicture->drawText(350,55,"My chart title",array("FontSize"=>20,"Align"=>TEXT_ALIGN_BOTTOMMIDDLE));
 $myPicture->drawFilledRectangle(90,60,660,190,array("R"=>255,"G"=>255,"B"=>255,"Surrounding"=>-200,"Alpha"=>10));

 /* Compute and draw the scale */
 $myPicture->drawScale(array("DrawYLines"=>array(0)));
© Copyrights
Components used on this web site : Famfamfam icons has been made by Mark James, Rounded corners lite has been coded by Cameron Cooke and Tim Hutchison, SyntaxHighlighter has
been written by Alex Gorbatchev. pChart and this web site have been created by Jean-Damien POGOLOTTI. This documentation contains 185 pages and 56 comments. 415 users have registered.
This page has been rendered in 0,01 seconds. Wiki revision 1.37.
|