|
Language Reference » Scatter chart » drawScatterScale
|
|
Latest updates
Toolbox
Google AdSense
|
drawScatterScale - Compute & draw the scatter chart scale This function will compute and draw the scale of your scatter charts. It is possible to tune the rendering by playing with the $Format array. To learn more about this please read the Format array guide.
Calling this function
drawScatterScale($Format="");Where : Format is an array containing the drawing parameters of the arrow. Customisation array - Tune up your scales! It is possible to customize the way your scale will be rendered by playing with this array. Providing a detailled configuration is not mandatory, by default the axis will be drawn black in the Left / Right mode. The scale orientation can be set with Pos, valid values are SCALE_POS_LEFTRIGHT and SCALE_POS_TOPBOTTOM
You can specify the rotation of the X Axis labels with LabelRotation.
The minimum height of a scale div can be set using MinDivHeight.
The scaling factors can be set using Factors.
The X Axis margin can be set using XMargin.
The Y Axis margin can be set using YMargin.
The space between two scales on the same side can be set using ScaleSpacing.
You can specify if you want to draw the X grid lines setting DrawXLines to TRUE or FALSE.
You can specify if you want to draw the Y grid lines setting DrawYLines to ALL, NONE or to an array containing the axis IDs.
You can draw dashed grid lines setting GridTicks to the width of the ticks.
You can specify the grid color using GridR,GridG,GridB.
You can specify the grid alpha factor using GridAlpha.
You can specify the axis color using AxisR,AxisG,AxisB.
You can specify the axis alpha factor using AxisAlpha.
The inner ticks width can be set using InnerTickWidth.
The outer ticks width can be set using OuterTickWidth.
You can specify the ticks color using TickR,TickG,TickB.
You can specify the ticks alpha factor using TickAlpha.
If you want to draw the subticks of the Y axis set DrawSubTicks to TRUE.
The inner subticks width can be set using InnerSubTickWidth.
The outer subticks width can be set using OuterSubTickWidth.
You can specify the subticks color using SubTickR,SubTickG,SubTickB.
You can specify the subticks alpha factor using SubTickAlpha.
You can specify if you want to draw the axis arrows setting DrawArrows to TRUE or FALSE.
You can set the arrow size usingArrowSize.
You can choose to display a 2-colors cycling background setting CycleBackground to TRUE.
First background cycling color can be defined with BackgroundR1,BackgroundG1,BackgroundB1,BackgroundAlpha1.
2nd background cycling color can be defined with BackgroundR2,BackgroundG2,BackgroundB2,BackgroundAlpha2. Depending on the chart you‘ll draw, you can define the way the scale will be computed with the Mode parameter : SCALE_MODE_FLOATING for min/max automatic scaling.
SCALE_MODE_START0 for fixed min to 0.
SCALE_MODE_ADDALL for stacked charts.
SCALE_MODE_ADDALL_START0 for stacked charts with a fixed min to 0.
SCALE_MODE_MANUAL to fix manually the min & max values. If you choose the manual option, you‘ll have to provide an array with the ManualScale parameter to provide the min & max values per axis. This array should have the following structure :
$AxisBoundaries = array(0=>array("Min"=>0,"Max"=>100),1=>array("Min"=>10,"Max"=>20));
You can also provide the Rows and RowHeight parameters for each axis.
Sample script #1 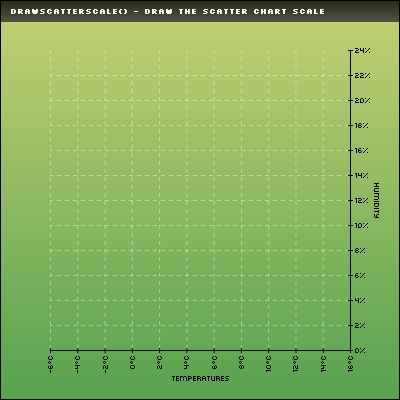
/* pChart library inclusions */
include("../class/pData.class.php");
include("../class/pDraw.class.php");
include("../class/pImage.class.php");
include("../class/pScatter.class.php");

/* Create the pData object */
$myData = new pData();

/* Create the X axis and the binded series */
$myData->addPoints(array(-4,VOID,VOID,12,8,3),"Probe 1");
$myData->addPoints(array(3,12,15,8,5,-5),"Probe 2");
$myData->setAxisName(0,"Temperatures");
$myData->setAxisXY(0,AXIS_X);
$myData->setAxisUnit(0,"°C");
$myData->setAxisPosition(0,AXIS_POSITION_BOTTOM);

/* Create the Y axis and the binded series */
$myData->addPoints(array(2,7,5,18,19,22),"Probe 3");
$myData->setSerieOnAxis("Probe 3",1);
$myData->setAxisName(1,"Humidity");
$myData->setAxisXY(1,AXIS_Y);
$myData->setAxisUnit(1,"%");
$myData->setAxisPosition(1,AXIS_POSITION_RIGHT);

/* Create the pChart object */
$myPicture = new pImage(400,400,$myData);

/* Draw the background */
$Settings = array("R"=>170, "G"=>183, "B"=>87, "Dash"=>1, "DashR"=>190, "DashG"=>203, "DashB"=>107);
 $myPicture->drawFilledRectangle(0,0,400,400,$Settings);

/* Overlay with a gradient */
$Settings = array("StartR"=>219, "StartG"=>231, "StartB"=>139, "EndR"=>1, "EndG"=>138, "EndB"=>68, "Alpha"=>50);
 $myPicture->drawGradientArea(0,0,400,400,DIRECTION_VERTICAL,$Settings);
$myPicture->drawGradientArea(0,0,400,20,DIRECTION_VERTICAL,array("StartR"=>0,"StartG"=>0,"StartB"=>0,"EndR"=>50,"EndG"=>50,"EndB"=>50,"Alpha"=>80));

/* Write the picture title */
$myPicture->setFontProperties(array("FontName"=>"../fonts/Silkscreen.ttf","FontSize"=>6));
 $myPicture->drawText(10,13,"drawScatterScale() - Draw the scatter chart scale",array("R"=>255,"G"=>255,"B"=>255));

/* Add a border to the picture */
$myPicture->drawRectangle(0,0,399,399,array("R"=>0,"G"=>0,"B"=>0));

/* Set the default font */
$myPicture->setFontProperties(array("FontName"=>"../fonts/pf_arma_five.ttf","FontSize"=>6));

/* Set the graph area */
$myPicture->setGraphArea(50,50,350,350);

/* Create the Scatter chart object */
$myScatter = new pScatter($myPicture,$myData);

/* Draw the scale */
$myScatter->drawScatterScale();

/* Render the picture (choose the best way) */
$myPicture->autoOutput("pictures/example.drawScatterScale.png");
This example shows how to create two axis and set their position.Sample script #2 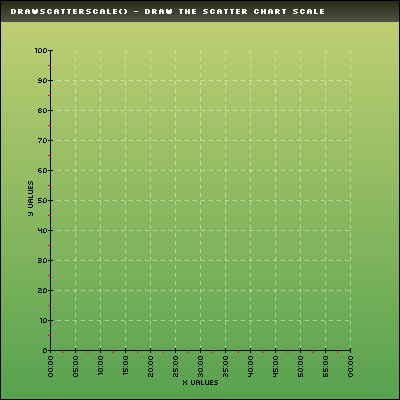
/* pChart library inclusions */
include("../class/pData.class.php");
include("../class/pDraw.class.php");
include("../class/pImage.class.php");
include("../class/pScatter.class.php");

/* Create the pData object */
$myData = new pData();

/* Create the X axis and the binded series */
$myData->addPoints(array(3,12,15,8,5,-5),"X Values");
$myData->setAxisName(0,"X Values");
$myData->setAxisXY(0,AXIS_X);
$myData->setAxisDisplay(0,AXIS_FORMAT_TIME,"i:s");
$myData->setAxisPosition(0,AXIS_POSITION_BOTTOM);

/* Create the Y axis and the binded series */
$myData->addPoints(array(2,7,5,18,19,22),"Y Values");
$myData->setSerieOnAxis("Y Values",1);
$myData->setAxisName(1,"Y Values");
$myData->setAxisXY(1,AXIS_Y);

/* Create the pChart object */
$myPicture = new pImage(400,400,$myData);

/* Draw the background */
$Settings = array("R"=>170, "G"=>183, "B"=>87, "Dash"=>1, "DashR"=>190, "DashG"=>203, "DashB"=>107);
 $myPicture->drawFilledRectangle(0,0,400,400,$Settings);

/* Overlay with a gradient */
$Settings = array("StartR"=>219, "StartG"=>231, "StartB"=>139, "EndR"=>1, "EndG"=>138, "EndB"=>68, "Alpha"=>50);
 $myPicture->drawGradientArea(0,0,400,400,DIRECTION_VERTICAL,$Settings);
$myPicture->drawGradientArea(0,0,400,20,DIRECTION_VERTICAL,array("StartR"=>0,"StartG"=>0,"StartB"=>0,"EndR"=>50,"EndG"=>50,"EndB"=>50,"Alpha"=>80));

/* Write the picture title */
$myPicture->setFontProperties(array("FontName"=>"../fonts/Silkscreen.ttf","FontSize"=>6));
 $myPicture->drawText(10,13,"drawScatterScale() - Draw the scatter chart scale",array("R"=>255,"G"=>255,"B"=>255));

/* Add a border to the picture */
$myPicture->drawRectangle(0,0,399,399,array("R"=>0,"G"=>0,"B"=>0));

/* Set the default font */
$myPicture->setFontProperties(array("FontName"=>"../fonts/pf_arma_five.ttf","FontSize"=>6));

/* Set the graph area */
$myPicture->setGraphArea(50,50,350,350);

/* Create the Scatter chart object */
$myScatter = new pScatter($myPicture,$myData);

/* Draw the scale */
$AxisBoundaries = array(0=>array("Min"=>0,"Max"=>3600,"Rows"=>12,"RowHeight"=>300),1=>array("Min"=>0,"Max"=>100));
 $ScaleSettings = array("Mode"=>SCALE_MODE_MANUAL,"ManualScale"=>$AxisBoundaries,"DrawSubTicks"=>TRUE);
 $myScatter->drawScatterScale($ScaleSettings);

/* Render the picture (choose the best way) */
$myPicture->autoOutput("pictures/example.drawScatterScale.manual.png");
This example shows how to create a manual scale providing the min and max values for the X / Y axis and the divisions settings for the X one.
© Copyrights
Components used on this web site : Famfamfam icons has been made by Mark James, Rounded corners lite has been coded by Cameron Cooke and Tim Hutchison, SyntaxHighlighter has
been written by Alex Gorbatchev. pChart and this web site have been created by Jean-Damien POGOLOTTI. This documentation contains 185 pages and 56 comments. 415 users have registered.
This page has been rendered in 0,01 seconds. Wiki revision 1.37.
|