|
Language Reference » Dataset functions » setAxisDisplay
|
|
Latest updates
Toolbox
Google AdSense
|
setAxisDisplay - Define the way to show values on one Y Axis This function allows you to set the kind of data to display on the Y Axis. Depending on the type choosen, data will be computed in different ways. Values on this axis are automatically computed by the scaling algorithm.
Calling this function
setAxisDisplay($AxisID,$Mode,$Format=NULL); Where : AxisID is the ID of the axis we want to name.
Mode is the kind of data that will be displayed.
Format is the way to display in the associated mode. Valid Mode possible values are : AXIS_FORMAT_DEFAULT to display raw data.
AXIS_FORMAT_TIME to convert to time (HH:MM:SS).
AXIS_FORMAT_DATE to convert to date (D/M/Y).
AXIS_FORMAT_METRIC to convert to metric values (1k).
AXIS_FORMAT_CURRENCY to convert to curencies (1.200€).
AXIS_FORMAT_CUSTOM to use a custom callback. Depending on the choosen Mode, you can specify a custom format using the Format parameter. Valid formats are : For AXIS_FORMAT_TIME values you may provide a PHP date format. (like "H:i:s")
For AXIS_FORMAT_DATE values you may provide a PHP date format. (like "d/m/y")
For AXIS_FORMAT_CURENCY values you may provide a currency. (like $ or €)
For AXIS_FORMAT_CUSTOM values you must provide a function name. (see example) Sample script #1 /* Create the pData object */ $MyData = new pData(); /* The default ordinate axis will use metric conversion of the values */ $MyData->setAxisDisplay(0,AXIS_FORMAT_METRIC); /* The second ordinate axis will use time with a custom display mask */ $MyData->setAxisDisplay(1,AXIS_FORMAT_TIME,"H:i"); Sample script #2 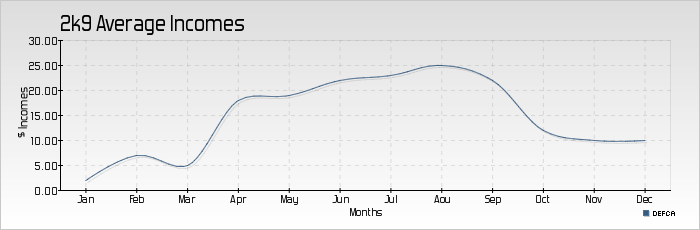
 $MyData = new pData();

 /* Prepare some nice data & axis config */
 $MyData->addPoints(array(2,7,5,18,19,22,23,25,22,12,10,10),"DEFCA");
 $MyData->setAxisName(0,"$ Incomes");
 $MyData->setAxisDisplay(0,AXIS_FORMAT_CURRENCY);
 $MyData->addPoints(array("Jan","Feb","Mar","Apr","May","Jun","Jul","Aou","Sep","Oct","Nov","Dec"),"Labels");
 $MyData->setSerieDescription("Labels","Months");
 $MyData->setAbscissa("Labels");
 $MyData->setPalette("Data",array("R"=>55,"G"=>91,"B"=>127));

 /* Define the graph area and do some makeup */
 $myPicture = new pImage(700,230,$MyData);
 $myPicture->drawGradientArea(0,0,700,230,DIRECTION_VERTICAL,array("StartR"=>220,"StartG"=>220,"StartB"=>220,"EndR"=>255,"EndG"=>255,"EndB"=>255,"Alpha"=>100));
 $myPicture->drawRectangle(0,0,699,229,array("R"=>100,"G"=>100,"B"=>100));
  $myPicture->setFontProperties(array("FontName"=>"fonts/Forgotte.ttf","FontSize"=>11));
 $myPicture->drawText(60,35,"2k9 Average Incomes",array("FontSize"=>20,"Align"=>TEXT_ALIGN_BOTTOMLEFT));
 $myPicture->setGraphArea(60,40,670,190);
 $myPicture->drawFilledRectangle(60,40,670,190,array("R"=>255,"G"=>255,"B"=>255,"Surrounding"=>-200,"Alpha"=>10));

 /* Compute and draw the scale */
  $myPicture->drawScale(array("GridR"=>180,"GridG"=>180,"GridB"=>180));

 /* Build the chart */
 $myPicture->setShadow(TRUE,array("X"=>2,"Y"=>2,"R"=>0,"G"=>0,"B"=>0,"Alpha"=>10));
 $myPicture->setFontProperties(array("FontName"=>"fonts/pf_arma_five.ttf","FontSize"=>6));
 $myPicture->drawSplineChart();
 $myPicture->setShadow(FALSE);

 /* Write the legend */
 $myPicture->drawLegend(643,210,array("Style"=>LEGEND_NOBORDER,"Mode"=>LEGEND_HORIZONTAL));
Sample script #3 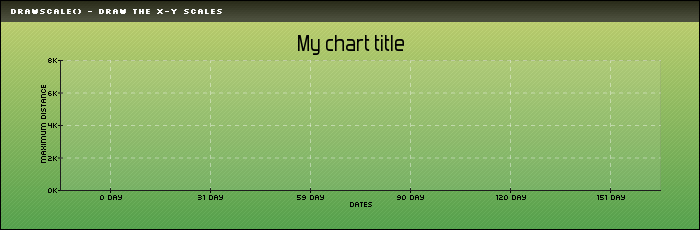
 /* pChart library inclusions */
 include("../class/pData.class.php");
 include("../class/pDraw.class.php");
 include("../class/pImage.class.php");

 /* Create and populate the pData object */
 $MyData = new pData();
 $MyData->addPoints(array(1700,2500,7800,4500,3150),"Distance");
 $MyData->setAxisName(0,"Maximum distance");
 $MyData->setAxisUnit(0,"m");
 $MyData->setAxisDisplay(0,AXIS_FORMAT_CUSTOM,"YAxisFormat");

 /* Create the abscissa serie */
 $MyData->addPoints(array(1230768000,1233446400,1235865600,1238544000,1241136000,1243814400),"Timestamp");
 $MyData->setSerieDescription("Timestamp","Sampled Dates");
 $MyData->setAbscissa("Timestamp");
 $MyData->setAbscissaName("Dates");
 $MyData->setXAxisDisplay(AXIS_FORMAT_CUSTOM,"XAxisFormat");

 /* Create the pChart object */
 $myPicture = new pImage(700,230,$MyData);

 /* Draw the background */
 $Settings = array("R"=>170, "G"=>183, "B"=>87, "Dash"=>1, "DashR"=>190, "DashG"=>203, "DashB"=>107);
 $myPicture->drawFilledRectangle(0,0,700,230,$Settings);

 /* Overlay with a gradient */
 $Settings = array("StartR"=>219, "StartG"=>231, "StartB"=>139, "EndR"=>1, "EndG"=>138, "EndB"=>68, "Alpha"=>50);
 $myPicture->drawGradientArea(0,0,700,230,DIRECTION_VERTICAL,$Settings);
 $myPicture->drawGradientArea(0,0,700,20,DIRECTION_VERTICAL,array("StartR"=>0,"StartG"=>0,"StartB"=>0,"EndR"=>50,"EndG"=>50,"EndB"=>50,"Alpha"=>80));

 /* Add a border to the picture */
 $myPicture->drawRectangle(0,0,699,229,array("R"=>0,"G"=>0,"B"=>0));

 /* Write the picture title */
 $myPicture->setFontProperties(array("FontName"=>"../fonts/Silkscreen.ttf","FontSize"=>6));
 $myPicture->drawText(10,13,"drawScale() - draw the X-Y scales",array("R"=>255,"G"=>255,"B"=>255));

 /* Set the default font */
 $myPicture->setFontProperties(array("FontName"=>"../fonts/pf_arma_five.ttf","FontSize"=>6));

 /* Draw the scale */
 $myPicture->setGraphArea(60,60,660,190);
 $myPicture->drawScale();
 $myPicture->drawFilledRectangle(60,60,660,190,array("R"=>255,"G"=>255,"B"=>255,"Surrounding"=>-200,"Alpha"=>10));

 /* Write the chart title */
 $myPicture->setFontProperties(array("FontName"=>"../fonts/Forgotte.ttf","FontSize"=>11));
 $myPicture->drawText(350,55,"My chart title",array("FontSize"=>20,"Align"=>TEXT_ALIGN_BOTTOMMIDDLE));

 /* Render the picture (choose the best way) */
 $myPicture->autoOutput("pictures/example.drawScale.custom.png");

 function YAxisFormat($Value) { return(round($Value/1000,2)."k"); }
 function XAxisFormat($Value) { return((($Value-1230768000)/(60*60*24))." day"); }
© Copyrights
Components used on this web site : Famfamfam icons has been made by Mark James, Rounded corners lite has been coded by Cameron Cooke and Tim Hutchison, SyntaxHighlighter has
been written by Alex Gorbatchev. pChart and this web site have been created by Jean-Damien POGOLOTTI. This documentation contains 185 pages and 56 comments. 415 users have registered.
This page has been rendered in 0,01 seconds. Wiki revision 1.37.
|