|
Language Reference » Spring charts functions » linkProperties
|
|
Latest updates
Toolbox
Google AdSense
|
linkProperties - Defines the properties of a link between two nodes This function allows you to specify the properties of a link between two nodes. You can specify the link color, ticks and text. Parameters are given trough a $Settings array. To learn more about this please read the Format array guide. Calling this function
linkProperties($FromNode,$ToNode,$Settings);Where : FromNode is the ID of the starting node.
ToNode is the ID of the ending node.
Settings array - Tune up your link! It is possible to customize the color, ticks and text of the link with this array. Link color can be set with R, G, B.
Ticks width can be set with Ticks.
Link text can be set with Name. Sample script 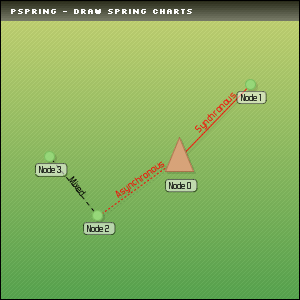
 /* pChart library inclusions */
 include("class/pData.class.php");
 include("class/pDraw.class.php");
 include("class/pSpring.class&.phpquot;);
 include("class/pImage.class");

 /* Create the pChart object */
 $myPicture = new pImage(300,300);

 /* Create the background */
 $myPicture->drawGradientArea(0,0,300,300,DIRECTION_HORIZONTAL,array("StartR"=>217,"StartG"=>250,"StartB"=>116,"EndR"=>181,"EndG"=>209,"EndB"=>27,"Alpha"=>100));
 $myPicture->drawGradientArea(0,0,300,20,DIRECTION_VERTICAL,array("StartR"=>0,"StartG"=>0,"StartB"=>0,"EndR"=>50,"EndG"=>50,"EndB"=>50,"Alpha"=>100));
 $myPicture->drawRectangle(0,0,299,299,array("R"=>0,"G"=>0,"B"=>0));
 $myPicture->setFontProperties(array("FontName"=>"fonts/Silkscreen.ttf","FontSize"=>6));
 $myPicture->drawText(10,13,"pSpring - Draw spring charts",array("R"=>255,"G"=>255,"B"=>255));


 /* Define the charting area & stuff */
 $myPicture->setGraphArea(20,20,280,280);
 $myPicture->setFontProperties(array("FontName"=>"fonts/Forgotte.ttf","FontSize"=>9,"R"=>80,"G"=>80,"B"=>80));
 $myPicture->setShadow(TRUE,array("X"=>2,"Y"=>2,"R"=>0,"G"=>0,"B"=>0,"Alpha"=>10));

 /* Create the pSpring object */
 $SpringChart = new pSpring();

 /* Define the default free zone size */
 $SpringChart->setNodeDefaults(array("FreeZone"=>100));

 /* Create some nodes & relations */
 $SpringChart->addNode(0,array("Shape"=>NODE_SHAPE_TRIANGLE,"FreeZone"=>60,"Size"=>20,"NodeType"=>NODE_TYPE_CENTRAL));
 $SpringChart->addNode(1,array("Connections"=>"0"));
 $SpringChart->addNode(2,array("Connections"=>"0"));
 $SpringChart->addNode(3,array("Connections"=>"2"));

 /* Define the nodes color */
 $SpringChart->setNodesColor(0,array("R"=>215,"G"=>163,"B"=>121,"BorderR"=>166,"BorderG"=>115,"BorderB"=>74));
 $SpringChart->setNodesColor(array(1,2,3),array("R"=>150,"G"=>215,"B"=>121,"Surrounding"=>-30));

 /* Customize some relations */
 $SpringChart->linkProperties(0,1,array("Name"=>"Synchronous","R"=>255,"G"=>0,"B"=>0));
 $SpringChart->linkProperties(0,2,array("Name"=>"Asynchronous","R"=>255,"G"=>0,"B"=>0,"Ticks"=>2));
 $SpringChart->linkProperties(3,2,array("Name"=>"Mixed","Ticks"=>4));

 /* Render the spring chart */
 $Result = $SpringChart->drawSpring($myPicture);
 print_r($Result);

 /* Render the picture */
 $myPicture->Render("drawspring4.png");
© Copyrights
Components used on this web site : Famfamfam icons has been made by Mark James, Rounded corners lite has been coded by Cameron Cooke and Tim Hutchison, SyntaxHighlighter has
been written by Alex Gorbatchev. pChart and this web site have been created by Jean-Damien POGOLOTTI. This documentation contains 185 pages and 56 comments. 415 users have registered.
This page has been rendered in 0,01 seconds. Wiki revision 1.37.
|