|
Language Reference » Settings functions » setPalette
|
|
Latest updates
Toolbox
Google AdSense
|
setPalette - Associate color to your Data series This function allows you to modify the series color schemes by associating a color to one serie. Parameters are given trough a $Format array. To learn more about this please read the Format array guide. Calling this function
setPalette($Series,$Format="");Where : Series is the name of the serie that you want to customize. (or an array of series)
Format is an array containing the description of what you want to achieve. Customisation array - Choose your color! It is possible to specify the colors and alpha transparency of the given serie with this array. If nothing is specified, the serie will be drawn black with no transparency. The font color can be set with R, G, B.
The alpha transparency factor can be set with Alpha. A lot of sites are providing nice looking color schemes on internet. It is important to keep in mind that the color must be visible on the background you‘ve choosen and that all series must be visually different.  Sample script #1
 /* Create the pData object */
 $MyData = new pData();

 /* Populate some data */
 $MyData->addPoints(array(24,25,26,25,25),"My Serie 1");
 $MyData->addPoints(array(1,7,5,6,8),"My Serie 2");
 $MyData->addPoints(array(6,7,8,0,6),"My Serie 3");

 /* Draw serie 1 in red with a 80% opacity */
 $serieSettings = array("R"=>229,"G"=>11,"B"=>11,"Alpha"=>80);
 $MyData->setPalette("My Serie 1",$serieSettings);

 /* Affect the same palette on different series */
 $serieSettings = array("R"=>255,"G"=>0,"B"=>0);
 $MyData->setPalette(array("My Serie 2","My Serie 3"),$serieSettings);
Sample script #2 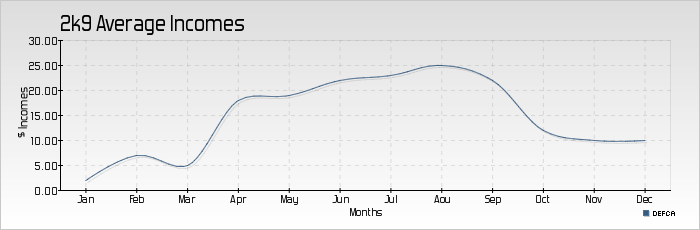
 /* pChart library inclusions */
 include("../class/pData.class.php");
 include("../class/pDraw.class.php");
 include("../class/pImage.class.php");

 /* Create and populate the pData object */
 $MyData = new pData();
 $MyData->addPoints(array(2,7,5,18,19,22,23,25,22,12,10,10),"DEFCA");
 $MyData->setAxisName(0,"$ Incomes");
 $MyData->setAxisDisplay(0,AXIS_FORMAT_CURRENCY);
 $MyData->addPoints(array("Jan","Feb","Mar","Apr","May","Jun","Jul","Aou","Sep","Oct","Nov","Dec"),"Labels");
 $MyData->setSerieDescription("Labels","Months");
 $MyData->setAbscissa("Labels");
 $MyData->setPalette("DEFCA",array("R"=>55,"G"=>91,"B"=>127));

 /* Create the pChart object */
 $myPicture = new pImage(700,230,$MyData);
 $myPicture->drawGradientArea(0,0,700,230,DIRECTION_VERTICAL,array("StartR"=>220,"StartG"=>220,"StartB"=>220,"EndR"=>255,"EndG"=>255,"EndB"=>255,"Alpha"=>100));
 $myPicture->drawRectangle(0,0,699,229,array("R"=>200,"G"=>200,"B"=>200));

 /* Write the picture title */
 $myPicture->setFontProperties(array("FontName"=>"../fonts/Forgotte.ttf","FontSize"=>11));
 $myPicture->drawText(60,35,"2k9 Average Incomes",array("FontSize"=>20,"Align"=>TEXT_ALIGN_BOTTOMLEFT));

 /* Do some cosmetic and draw the chart */
 $myPicture->setGraphArea(60,40,670,190);
 $myPicture->drawFilledRectangle(60,40,670,190,array("R"=>255,"G"=>255,"B"=>255,"Surrounding"=>-200,"Alpha"=>10));
 $myPicture->drawScale(array("GridR"=>180,"GridG"=>180,"GridB"=>180));
 $myPicture->setShadow(TRUE,array("X"=>2,"Y"=>2,"R"=>0,"G"=>0,"B"=>0,"Alpha"=>10));
 $myPicture->setFontProperties(array("FontName"=>"../fonts/pf_arma_five.ttf","FontSize"=>6));
 $myPicture->drawSplineChart();
 $myPicture->setShadow(FALSE);

 /* Write the chart legend */
 $myPicture->drawLegend(643,210,array("Style"=>LEGEND_NOBORDER,"Mode"=>LEGEND_HORIZONTAL));

 /* Render the picture (choose the best way) */
 $myPicture->autoOutput("pictures/example.drawSimple.png");
© Copyrights
Components used on this web site : Famfamfam icons has been made by Mark James, Rounded corners lite has been coded by Cameron Cooke and Tim Hutchison, SyntaxHighlighter has
been written by Alex Gorbatchev. pChart and this web site have been created by Jean-Damien POGOLOTTI. This documentation contains 185 pages and 56 comments. 415 users have registered.
This page has been rendered in 0,01 seconds. Wiki revision 1.37.
|