|
Language Reference » Surface charts » setGrid
|
|
Latest updates
Toolbox
Google AdSense
|
setGrid - Define the size of the matrix This function allows you to define the size of the matrix used for the surface chart. Calling this function
setGrid($XSize=10,$YSize=10)Where : XSize is the width of the matrix.
YSize is the height of the matrix. Sample script 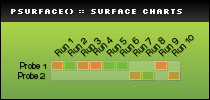
 /* pChart library inclusions */
 include("../class/pData.class.php");
 include("../class/pDraw.class.php");
 include("../class/pImage.class.php");
 include("../class/pSurface.class.php");

 /* Create the pChart object */
 $myPicture = new pImage(210,100);

 /* Create a solid background */
 $Settings = array("R"=>179, "G"=>217, "B"=>91, "Dash"=>1, "DashR"=>199, "DashG"=>237, "DashB"=>111);
 $myPicture->drawFilledRectangle(0,0,210,100,$Settings);

 /* Do a gradient overlay */
 $Settings = array("StartR"=>194, "StartG"=>231, "StartB"=>44, "EndR"=>43, "EndG"=>107, "EndB"=>58, "Alpha"=>50);
 $myPicture->drawGradientArea(0,0,210,100,DIRECTION_VERTICAL,$Settings);
 $myPicture->drawGradientArea(0,0,210,20,DIRECTION_VERTICAL,array("StartR"=>0,"StartG"=>0,"StartB"=>0,"EndR"=>50,"EndG"=>50,"EndB"=>50,"Alpha"=>100));

 /* Add a border to the picture */
 $myPicture->drawRectangle(0,0,209,99,array("R"=>0,"G"=>0,"B"=>0));

 /* Write the picture title */
 $myPicture->setFontProperties(array("FontName"=>"../fonts/Silkscreen.ttf","FontSize"=>6));
 $myPicture->drawText(10,13,"pSurface() :: Surface charts",array("R"=>255,"G"=>255,"B"=>255));

 /* Define the charting area */
 $myPicture->setGraphArea(50,60,180,80);
 $myPicture->drawFilledRectangle(50,60,180,80,array("R"=>255,"G"=>255,"B"=>255,"Surrounding"=>-200,"Alpha"=>20));

 $myPicture->setShadow(TRUE,array("X"=>1,"Y"=>1));

 /* Create the surface object */
 $mySurface = new pSurface($myPicture);

 /* Set the grid size */
 $mySurface->setGrid(9,1);

 /* Write the axis labels */
 $myPicture->setFontProperties(array("FontName"=>"../fonts/pf_arma_five.ttf","FontSize"=>6));

 $myPicture->setFontProperties(array("FontName"=>"../fonts/Bedizen.ttf","FontSize"=>7));

 $mySurface->writeXLabels(array("Angle"=>45,"Labels"=>array("Run 1","Run 2","Run 3","Run 4","Run 5","Run 6","Run 7","Run 8","Run 9","Run 10")));
 $mySurface->writeYLabels(array("Labels"=>array("Probe 1","Probe 2")));

 /* Add random values */
 for($i=0; $i<=10; $i++) { $mySurface->addPoint($i,rand(0,1),rand(0,100)); }

 /* Draw the surface chart */
 $mySurface->drawSurface(array("Border"=>TRUE,"Surrounding"=>40));

 /* Render the picture (choose the best way) */
 $myPicture->autoOutput("pictures/example.surface.simple.png");
© Copyrights
Components used on this web site : Famfamfam icons has been made by Mark James, Rounded corners lite has been coded by Cameron Cooke and Tim Hutchison, SyntaxHighlighter has
been written by Alex Gorbatchev. pChart and this web site have been created by Jean-Damien POGOLOTTI. This documentation contains 185 pages and 56 comments. 415 users have registered.
This page has been rendered in 0,01 seconds. Wiki revision 1.37.
|