|
Language Reference » Dataset functions » normalize
|
|
Latest updates
Toolbox
Google AdSense
|
normalize - Normalize your data series This function allow you to normalize your data series by providing a 0-value range. This function is usually called when we want to normalize the dataset to a 100% scale. The points that are computed will replace your data series, each data row sum will be equal to the value provided.
Calling this function
normalize($NormalizationFactor=100,$UnitChange=NULL,$Round=0);Where : NormalizationFactor is the value used for the normalization process. Usually 100.
UnitChange, if provided will override the axis unit. Set it to "%" if you use a factor 100.
Round is the number of decimal value to keep. All parameters are optional Sample script 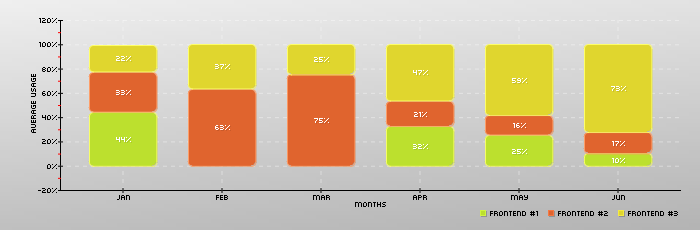
 include("class/pData.class.php");
 include("class/pDraw.class.php");
 include("class/pImage.class.php");

 $MyData = new pData();
 $MyData->addPoints(array(-4,VOID,VOID,12,8,3),"Frontend #1");
 $MyData->addPoints(array(3,12,15,8,5,-5),"Frontend #2");
 $MyData->addPoints(array(2,7,5,18,19,22),"Frontend #3");
 $MyData->setAxisName(0,"Average Usage");
 $MyData->addPoints(array("Jan","Feb","Mar","Apr","May","Jun"),"Labels");
 $MyData->setSerieDescription("Labels","Months");
 $MyData->setAbscissa("Labels");

 $MyData->normalize(100,"%");

 $myPicture = new pImage(700,230,$MyData);
 $myPicture->drawGradientArea(0,0,700,230,DIRECTION_VERTICAL,array("StartR"=>240,"StartG"=>240,"StartB"=>240,"EndR"=>180,"EndG"=>180,"EndB"=>180,"Alpha"=>100));
 $myPicture->drawGradientArea(0,0,700,230,DIRECTION_HORIZONTAL,array("StartR"=>240,"StartG"=>240,"StartB"=>240,"EndR"=>180,"EndG"=>180,"EndB"=>180,"Alpha"=>20));

 $myPicture->setFontProperties(array("FontName"=>"fonts/pf_arma_five.ttf","FontSize"=>6));

 $myPicture->setGraphArea(60,20,680,190);
 $myPicture->drawScale(array("DrawSubTicks"=>TRUE,"Mode"=>SCALE_MODE_ADDALL));
 $myPicture->setShadow(TRUE,array("X"=>1,"Y"=>1,"R"=>0,"G"=>0,"B"=>0,"Alpha"=>10));
 $myPicture->drawStackedBarChart(array("DisplayValues"=>TRUE,"DisplayColor"=>DISPLAY_AUTO,"Rounded"=>TRUE,"Surrounding"=>60));
 $myPicture->setShadow(FALSE);

 $myPicture->drawLegend(480,210,array("Style"=>LEGEND_NOBORDER,"Mode"=>LEGEND_HORIZONTAL));

 $myPicture->Render("normalize.png");
© Copyrights
Components used on this web site : Famfamfam icons has been made by Mark James, Rounded corners lite has been coded by Cameron Cooke and Tim Hutchison, SyntaxHighlighter has
been written by Alex Gorbatchev. pChart and this web site have been created by Jean-Damien POGOLOTTI. This documentation contains 185 pages and 56 comments. 415 users have registered.
This page has been rendered in 0,01 seconds. Wiki revision 1.37.
|