|
Language Reference » Pie charts class » draw2DRing
|
|
Latest updates
Toolbox
Google AdSense
|
draw2DRing - Draw 2D ring charts This function allows you to draw a 2D ring chart. All the drawing parameters are given trough a $Format array. To learn more about this please read the Format array guide. Calling this function
draw2DRing($X,$Y,$Format);Where : X,Y is the center coordinate of the pie. (Radius can be adjusted in the Format array)
Format is an array containing the drawing parameters of the chart. Customisation array - Tune up your chart! It is possible to customize the pie chart rendering by playing with this array. Providing a detailled configuration is not mandatory. You‘ll see below a representation of all the customization possible : You can specify if the outer radius of the pie chart with OuterRadius.
You can specify if the inner radius of the pie chart with InnerRadius.
You can draw a border around the pie parts setting Border to TRUE.
You can set the border color with BorderR,BorderG,BorderB.
You can write the data labels setting DrawLabels to TRUE.
The labels colors can be set with LabelR,LabelG,LabelB,LabelAlpha.
You can enable image map recording by setting RecordImageMap to TRUE.
You can set LabelStacked to TRUE in order to get an automatic positionning of the labels (Example #2) The color of the labels can be defined statically or dynamically setting LabelColor to : PIE_LABEL_COLOR_MANUAL to manually provide a single color (LabelR,...)
PIE_LABEL_COLOR_AUTO to re-use the color of the data series. You can also display the data values : You can write the data values setting WriteValues to TRUE or to PIE_VALUE_PERCENTAGE if you want to display the computed percentages.
You can specify the values color with ValueR,ValueG,ValueB,ValueAlpha.
You can specify the values sufix with ValueSuffix.
You can specify the padding for the values with ValuePadding.
You can define the number of decimals in the percentages with Precision. You can specify where the values will be written setting ValuePosition to : PIE_VALUE_INSIDE to write the values inside the pie chart.
PIE_VALUE_OUTSIDE to write the values outside of the pie chart. Sample script #1 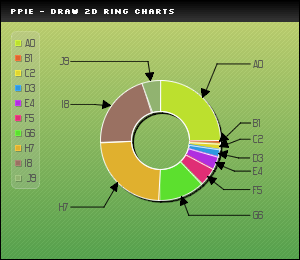
 /* pChart library inclusions */
 include("../class/pData.class.php");
 include("../class/pDraw.class.php");
 include("../class/pPie.class.php");
 include("../class/pImage.class.php");

 /* Create and populate the pData object */
 $MyData = new pData();
 $MyData->addPoints(array(50,2,3,4,7,10,25,48,41,10),"ScoreA");
 $MyData->setSerieDescription("ScoreA","Application A");

 /* Define the absissa serie */
 $MyData->addPoints(array("A0","B1","C2","D3","E4","F5","G6","H7","I8","J9"),"Labels");
 $MyData->setAbscissa("Labels");

 /* Create the pChart object */
 $myPicture = new pImage(300,260,$MyData);

 /* Draw a solid background */
 $Settings = array("R"=>170, "G"=>183, "B"=>87, "Dash"=>1, "DashR"=>190, "DashG"=>203, "DashB"=>107);
 $myPicture->drawFilledRectangle(0,0,300,300,$Settings);

 /* Overlay with a gradient */
 $Settings = array("StartR"=>219, "StartG"=>231, "StartB"=>139, "EndR"=>1, "EndG"=>138, "EndB"=>68, "Alpha"=>50);
 $myPicture->drawGradientArea(0,0,300,260,DIRECTION_VERTICAL,$Settings);
 $myPicture->drawGradientArea(0,0,300,20,DIRECTION_VERTICAL,array("StartR"=>0,"StartG"=>0,"StartB"=>0,"EndR"=>50,"EndG"=>50,"EndB"=>50,"Alpha"=>100));

 /* Add a border to the picture */
 $myPicture->drawRectangle(0,0,299,259,array("R"=>0,"G"=>0,"B"=>0));

 /* Write the picture title */
 $myPicture->setFontProperties(array("FontName"=>"../fonts/Silkscreen.ttf","FontSize"=>6));
 $myPicture->drawText(10,13,"pPie - Draw 2D ring charts",array("R"=>255,"G"=>255,"B"=>255));

 /* Set the default font properties */
 $myPicture->setFontProperties(array("FontName"=>"../fonts/Forgotte.ttf","FontSize"=>10,"R"=>80,"G"=>80,"B"=>80));

 /* Enable shadow computing */
 $myPicture->setShadow(TRUE,array("X"=>2,"Y"=>2,"R"=>0,"G"=>0,"B"=>0,"Alpha"=>50));

 /* Create the pPie object */
 $PieChart = new pPie($myPicture,$MyData);

 /* Draw an AA pie chart */
 $PieChart->draw2DRing(160,140,array("DrawLabels"=>TRUE,"LabelStacked"=>TRUE,"Border"=>TRUE))

 /* Write the legend box */
 $myPicture->setShadow(FALSE);
 $PieChart->drawPieLegend(15,40,array("Alpha"=>20));

 /* Render the picture (choose the best way) */
 $myPicture->autoOutput("pictures/example.draw2DRing.png");
Sample script #2 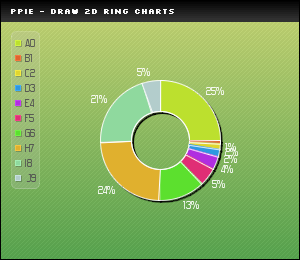
 /* pChart library inclusions */
 include("../class/pData.class.php");
 include("../class/pDraw.class.php");
 include("../class/pPie.class.php");
 include("../class/pImage.class.php");

 /* Create and populate the pData object */
 $MyData = new pData();
 $MyData->addPoints(array(50,2,3,4,7,10,25,48,41,10),"ScoreA");
 $MyData->setSerieDescription("ScoreA","Application A");

 /* Define the absissa serie */
 $MyData->addPoints(array("A0","B1","C2","D3","E4","F5","G6","H7","I8","J9"),"Labels");
 $MyData->setAbscissa("Labels");

 /* Create the pChart object */
 $myPicture = new pImage(300,260,$MyData);

 /* Draw a solid background */
 $Settings = array("R"=>170, "G"=>183, "B"=>87, "Dash"=>1, "DashR"=>190, "DashG"=>203, "DashB"=>107);
 $myPicture->drawFilledRectangle(0,0,300,300,$Settings);

 /* Overlay with a gradient */
 $Settings = array("StartR"=>219, "StartG"=>231, "StartB"=>139, "EndR"=>1, "EndG"=>138, "EndB"=>68, "Alpha"=>50);
 $myPicture->drawGradientArea(0,0,300,260,DIRECTION_VERTICAL,$Settings);
 $myPicture->drawGradientArea(0,0,300,20,DIRECTION_VERTICAL,array("StartR"=>0,"StartG"=>0,"StartB"=>0,"EndR"=>50,"EndG"=>50,"EndB"=>50,"Alpha"=>100));

 /* Add a border to the picture */
 $myPicture->drawRectangle(0,0,299,259,array("R"=>0,"G"=>0,"B"=>0));

 /* Write the picture title */
 $myPicture->setFontProperties(array("FontName"=>"../fonts/Silkscreen.ttf","FontSize"=>6));
 $myPicture->drawText(10,13,"pPie - Draw 2D ring charts",array("R"=>255,"G"=>255,"B"=>255));

 /* Set the default font properties */
 $myPicture->setFontProperties(array("FontName"=>"../fonts/Forgotte.ttf","FontSize"=>10,"R"=>80,"G"=>80,"B"=>80));

 /* Enable shadow computing */
 $myPicture->setShadow(TRUE,array("X"=>2,"Y"=>2,"R"=>0,"G"=>0,"B"=>0,"Alpha"=>50));

 /* Create the pPie object */
 $PieChart = new pPie($myPicture,$MyData);

 /* Draw an AA pie chart */
 $PieChart->draw2DRing(160,140,array("WriteValues"=>TRUE,"ValueR"=>255,"ValueG"=>255,"ValueB"=>255,"Border"=>TRUE));

 /* Write the legend box */
 $myPicture->setShadow(FALSE);
 $PieChart->drawPieLegend(15,40,array("Alpha"=>20));

 /* Render the picture (choose the best way) */
 $myPicture->autoOutput("pictures/example.draw2DRingValue.png");
© Copyrights
Components used on this web site : Famfamfam icons has been made by Mark James, Rounded corners lite has been coded by Cameron Cooke and Tim Hutchison, SyntaxHighlighter has
been written by Alex Gorbatchev. pChart and this web site have been created by Jean-Damien POGOLOTTI. This documentation contains 185 pages and 56 comments. 415 users have registered.
This page has been rendered in 0,01 seconds. Wiki revision 1.37.
|