|
Language Reference » Linear Bubble chart » drawBubbleChart
|
|
Latest updates
Toolbox
Google AdSense
|
drawBubbleChart - Draw a linear bubble chart Require pChart 2.0.13 This function allows you to draw a bubble chart. All the drawing parameters are given trough a $Format array. To learn more about this please read the Format array guide. Calling this function
drawBubbleChart($DataSeries,$WeightSeries,$Format);Where : DataSeries is an array containing the name of the serie providing the Y values.
WeightSeries is an array containing the name of the serie providing the Z values.
Format is an array containing the drawing parameters of the chart. Customisation array - Tune up your chart! It is possible to customize the bubble chart rendering by playing with this array. Providing a detailled configuration is not mandatory. You‘ll see below a representation of all the customization possible : You can specify if a border will be drawn setting DrawBorder to TRUE.
You can specify the width of the border with BorderWidth.
You can draw squares instead of circles setting DrawSquare to TRUE.
You can specify the border color with BorderR, BorderG, BorderB.
You can specify the border alpha transparency factor with BorderAlpha.
You can specify a surrounding factor that will be added to the R,G,B values to compute the border color with Surrounding.
You can force the alpha transparency of the bubble with ForceAlpha.
You can enable image map recording by setting RecordImageMap to TRUE. You can specify the shape to use setting Shape to : BUBBLE_SHAPE_ROUND to draw circles
BUBBLE_SHAPE_SQUARE to draw squares Sample script #1 
 /* pChart library inclusions */
 include("../class/pData.class.php");
 include("../class/pDraw.class.php");
 include("../class/pImage.class.php");
 include("../class/pBubble.class.php");

 /* Create and populate the pData object */
 $MyData = new pData();
 $MyData->addPoints(array(34,55,15,62,38,42),"Probe1");
 $MyData->addPoints(array(5,10,8,9,15,10),"Probe1Weight");
 $MyData->addPoints(array(5,10,-5,-1,0,-10),"Probe2");
 $MyData->addPoints(array(6,10,14,10,14,6),"Probe2Weight");
 $MyData->setSerieDescription("Probe1","This year");
 $MyData->setSerieDescription("Probe2","Last year");
 $MyData->setAxisName(0,"Current stock");
 $MyData->addPoints(array("Apple","Banana","Orange","Lemon","Peach","Strawberry"),"Product");
 $MyData->setAbscissa("Product");

 /* Create the pChart object */
 $myPicture = new pImage(700,230,$MyData);

 /* Draw the background */
 $Settings = array("R"=>170, "G"=>183, "B"=>87, "Dash"=>1, "DashR"=>190, "DashG"=>203, "DashB"=>107);
 $myPicture->drawFilledRectangle(0,0,700,230,$Settings);

 /* Overlay with a gradient */
 $Settings = array("StartR"=>219, "StartG"=>231, "StartB"=>139, "EndR"=>1, "EndG"=>138, "EndB"=>68, "Alpha"=>50);
 $myPicture->drawGradientArea(0,0,700,230,DIRECTION_VERTICAL,$Settings);
 $myPicture->drawGradientArea(0,0,700,20,DIRECTION_VERTICAL,array("StartR"=>0,"StartG"=>0,"StartB"=>0,"EndR"=>50,"EndG"=>50,"EndB"=>50,"Alpha"=>80));

 /* Add a border to the picture */
 $myPicture->drawRectangle(0,0,699,229,array("R"=>0,"G"=>0,"B"=>0));

 /* Write the picture title */
 $myPicture->setFontProperties(array("FontName"=>"../fonts/Silkscreen.ttf","FontSize"=>6));
 $myPicture->drawText(10,13,"drawBubbleChart() - draw a linear bubble chart",array("R"=>255,"G"=>255,"B"=>255));

 /* Write the title */
 $myPicture->setFontProperties(array("FontName"=>"../fonts/Forgotte.ttf","FontSize"=>11));
 $myPicture->drawText(40,55,"Current Stock / Needs chart",array("FontSize"=>14,"Align"=>TEXT_ALIGN_BOTTOMLEFT));

 /* Change the default font */
 $myPicture->setFontProperties(array("FontName"=>"../fonts/pf_arma_five.ttf","FontSize"=>6));

 /* Create the Bubble chart object and scale up */
 $myBubbleChart = new pBubble($myPicture,$MyData);

 /* Scale up for the bubble chart */
 $bubbleDataSeries   = array("Probe1","Probe2");
 $bubbleWeightSeries = array("Probe1Weight","Probe2Weight");
 $myBubbleChart->bubbleScale($bubbleDataSeries,$bubbleWeightSeries);

 /* Draw the 1st chart */
 $myPicture->setGraphArea(40,60,430,190);
 $myPicture->drawFilledRectangle(40,60,430,190,array("R"=>255,"G"=>255,"B"=>255,"Surrounding"=>-200,"Alpha"=>10));
 $myPicture->drawScale(array("DrawSubTicks"=>TRUE,"CycleBackground"=>TRUE));
 $myPicture->setShadow(TRUE,array("X"=>1,"Y"=>1,"R"=>0,"G"=>0,"B"=>0,"Alpha"=>30));
 $myBubbleChart->drawBubbleChart($bubbleDataSeries,$bubbleWeightSeries);

 /* Draw the 2nd scale */
 $myPicture->setShadow(FALSE);
 $myPicture->setGraphArea(500,60,670,190);
 $myPicture->drawFilledRectangle(500,60,670,190,array("R"=>255,"G"=>255,"B"=>255,"Surrounding"=>-200,"Alpha"=>10));
 $myPicture->drawScale(array("Pos"=>SCALE_POS_TOPBOTTOM,"DrawSubTicks"=>TRUE));

 /* Draw the 2nd stock chart */
 $myPicture->setShadow(TRUE,array("X"=>1,"Y"=>1,"R"=>0,"G"=>0,"B"=>0,"Alpha"=>30));
 $myBubbleChart->drawbubbleChart($bubbleDataSeries,$bubbleWeightSeries);

 /* Write the chart legend */
 $myPicture->drawLegend(550,215,array("Style"=>LEGEND_NOBORDER,"Mode"=>LEGEND_HORIZONTAL));

 /* Render the picture (choose the best way) */
 $myPicture->autoOutput("pictures/example.drawBubbleChart.png");
Sample script #2 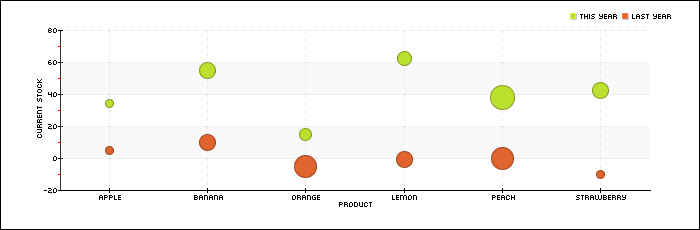
 /* pChart library inclusions */
 include("../class/pData.class.php");
 include("../class/pDraw.class.php");
 include("../class/pImage.class.php");
 include("../class/pBubble.class.php");

 /* Create and populate the pData object */
 $MyData = new pData();
 $MyData->addPoints(array(34,55,15,62,38,42),"Probe1");
 $MyData->addPoints(array(5,10,8,9,15,10),"Probe1Weight");
 $MyData->addPoints(array(5,10,-5,-1,0,-10),"Probe2");
 $MyData->addPoints(array(6,10,14,10,14,6),"Probe2Weight");
 $MyData->setSerieDescription("Probe1","This year");
 $MyData->setSerieDescription("Probe2","Last year");
 $MyData->setAxisName(0,"Current stock");
 $MyData->addPoints(array("Apple","Banana","Orange","Lemon","Peach","Strawberry"),"Product");
 $MyData->setAbscissa("Product");

 /* Create the pChart object */
 $myPicture = new pImage(700,230,$MyData);

 /* Turn of AAliasing */
 $myPicture->Antialias = FALSE;

 /* Draw the border */
 $myPicture->drawRectangle(0,0,699,229,array("R"=>0,"G"=>0,"B"=>0));

 /* Set the default font */
 $myPicture->setFontProperties(array("FontName"=>"../fonts/pf_arma_five.ttf","FontSize"=>6));

 /* Define the chart area */
 $myPicture->setGraphArea(60,30,650,190);

 /* Draw the scale */
 $scaleSettings = array("GridR"=>200,"GridG"=>200,"GridB"=>200,"DrawSubTicks"=>TRUE,"CycleBackground"=>TRUE);
 $myPicture->drawScale($scaleSettings);

 /* Create the Bubble chart object and scale up */
 $myPicture->Antialias = TRUE;
 $myBubbleChart = new pBubble($myPicture,$MyData);

 /* Scale up for the bubble chart */
 $bubbleDataSeries   = array("Probe1","Probe2");
 $bubbleWeightSeries = array("Probe1Weight","Probe2Weight");
 $myBubbleChart->bubbleScale($bubbleDataSeries,$bubbleWeightSeries);

 /* Draw the bubble chart */
 $myBubbleChart->drawBubbleChart($bubbleDataSeries,$bubbleWeightSeries);

 /* Write the chart legend */
 $myPicture->drawLegend(570,13,array("Style"=>LEGEND_NOBORDER,"Mode"=>LEGEND_HORIZONTAL));

 /* Render the picture (choose the best way) */
 $myPicture->autoOutput("pictures/example.drawBubbleChart.simple.png");
Sample script #3 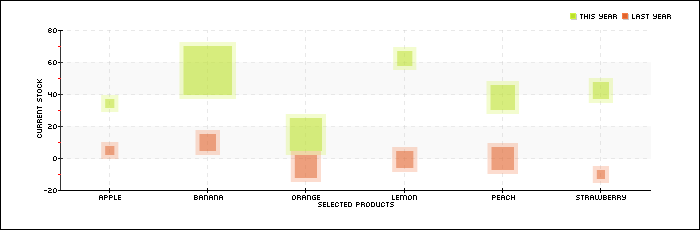
 /* pChart library inclusions */
 include("../class/pData.class.php");
 include("../class/pDraw.class.php");
 include("../class/pImage.class.php");
 include("../class/pBubble.class.php");

 /* Create and populate the pData object */
 $MyData = new pData();
 $MyData->addPoints(array(34,55,15,62,38,42),"Probe1");
 $MyData->addPoints(array(5,30,20,9,15,10),"Probe1Weight");
 $MyData->addPoints(array(5,10,-5,-1,0,-10),"Probe2");
 $MyData->addPoints(array(6,10,14,10,14,6),"Probe2Weight");
 $MyData->setSerieDescription("Probe1","This year");
 $MyData->setSerieDescription("Probe2","Last year");
 $MyData->setAxisName(0,"Current stock");
 $MyData->addPoints(array("Apple","Banana","Orange","Lemon","Peach","Strawberry"),"Product");
 $MyData->setAbscissa("Product");
 $MyData->setAbscissaName("Selected Products");

 /* Create the pChart object */
 $myPicture = new pImage(700,230,$MyData);

 /* Turn of AAliasing */
 $myPicture->Antialias = FALSE;

 /* Draw the border */
 $myPicture->drawRectangle(0,0,699,229,array("R"=>0,"G"=>0,"B"=>0));
 $myPicture->setFontProperties(array("FontName"=>"../fonts/pf_arma_five.ttf","FontSize"=>6));

 /* Define the chart area */
 $myPicture->setGraphArea(60,30,650,190);

 /* Draw the scale */
 $scaleSettings = array("GridR"=>200,"GridG"=>200,"GridB"=>200,"DrawSubTicks"=>TRUE,"CycleBackground"=>TRUE);
 $myPicture->drawScale($scaleSettings);

 /* Create the Bubble chart object and scale up */
 $myPicture->Antialias = TRUE;
 $myBubbleChart = new pBubble($myPicture,$MyData);

 /* Scale up for the bubble chart */
 $bubbleDataSeries   = array("Probe1","Probe2");
 $bubbleWeightSeries = array("Probe1Weight","Probe2Weight");
 $myBubbleChart->bubbleScale($bubbleDataSeries,$bubbleWeightSeries);

 /* Draw the bubble chart */
 $myBubbleChart->drawBubbleChart($bubbleDataSeries,$bubbleWeightSeries,array("Shape"=>BUBBLE_SHAPE_SQUARE,"ForceAlpha"=>50,"BorderWidth"=>4, "BorderAlpha"=>20,"Surrounding"=>20));

 /* Write the chart legend */
 $myPicture->drawLegend(570,13,array("Style"=>LEGEND_NOBORDER,"Mode"=>LEGEND_HORIZONTAL));

 /* Render the picture (choose the best way) */
 $myPicture->autoOutput("pictures/example.drawBubbleChart.square.png");
© Copyrights
Components used on this web site : Famfamfam icons has been made by Mark James, Rounded corners lite has been coded by Cameron Cooke and Tim Hutchison, SyntaxHighlighter has
been written by Alex Gorbatchev. pChart and this web site have been created by Jean-Damien POGOLOTTI. This documentation contains 185 pages and 56 comments. 415 users have registered.
This page has been rendered in 0,01 seconds. Wiki revision 1.37.
|