|
Language Reference » Dataset functions » setSerieOnAxis
|
|
Latest updates
Toolbox
Google AdSense
|
setSerieOnAxis - Bind a serie to one axis This function allows you to bind a data serie to one ordinate axis. You can create as many axis as you want. If the axis ID you are specifying does not exists it will be created with it‘s default parameters. You can then name it, place it and specify how to display data on it. It is important to create different axis to dispatch data series of different natures. You can‘t scale the same way temperatures (°C) and humidity values (%). Creating two axis, one for each kind of data will help you to display the link between this two entities on the same chart without stretching the scales.
Calling this function
setSerieOnAxis($Series,$AxisID); Where : Series is the name of the serie you want to bind to another axis. (or an array of names)
AxisID is the ID of the axis we want to name. Sample script #1
 /* Create the pData object */
 $MyData = new pData();

 /* Create some dummy data */
 $myData->addPoints(array(10,11,14,13),"Temperature");
 $myData->addPoints(array(70,70,69,68),"Humidity");

 /* Dispatch the two data series on dedicated axis */
 $MyData->setSerieOnAxis("Temperature",0); // This one isn‘t needed as this is the default serie
 $MyData->setSerieOnAxis("Humidity",1);
Sample script #2 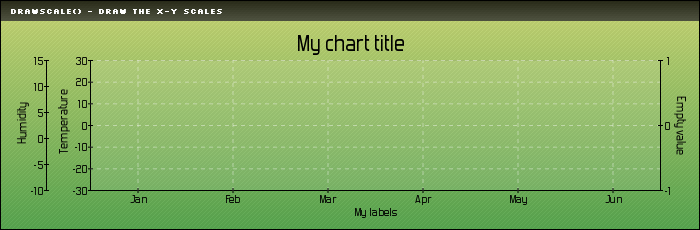
 $MyData = new pData();

 /* Prepare some nice data & axis config */
 $MyData->addPoints(array(24,-25,26,25,25),"Temperature");
 $MyData->addPoints(array(1,2,VOID,9,10),"Humidity 1");
 $MyData->addPoints(array(1,VOID,7,-9,0),"Humidity 2");
 $MyData->addPoints(array(-1,-1,-1,-1,-1),"Humidity 3");
 $MyData->addPoints(array(0,0,0,0,0),"Vide");
 $MyData->setSerieOnAxis("Temperature",0);
 $MyData->setSerieOnAxis("Humidity 1",1);
 $MyData->setSerieOnAxis("Humidity 2",1);
 $MyData->setSerieOnAxis("Humidity 3",1);
 $MyData->setSerieOnAxis("Vide",2);
 $MyData->setAxisPosition(2,AXIS_POSITION_RIGHT);
 $MyData->setAxisName(0,"Temperature");
 $MyData->setAxisName(1,"Humidity");
 $MyData->setAxisName(2,"Empty value");

 /* Bind a data serie to the X axis */
 $MyData->addPoints(array("Jan","Feb","Mar","Apr","May","Jun"),"Labels");
 $MyData->setSerieDescription("Labels","My labels");
 $MyData->setAbscissa("Labels");

 /* Define the graph area and do some makeup */
 $myPicture->setGraphArea(90,60,660,190);
 $myPicture->drawText(350,55,"My chart title",array("FontSize"=>20,"Align"=>TEXT_ALIGN_BOTTOMMIDDLE));
 $myPicture->drawFilledRectangle(90,60,660,190,array("R"=>255,"G"=>255,"B"=>255,"Surrounding"=>-200,"Alpha"=>10));

 /* Compute and draw the scale */
 $myPicture->drawScale(array("DrawYLines"=>array(0)));
© Copyrights
Components used on this web site : Famfamfam icons has been made by Mark James, Rounded corners lite has been coded by Cameron Cooke and Tim Hutchison, SyntaxHighlighter has
been written by Alex Gorbatchev. pChart and this web site have been created by Jean-Damien POGOLOTTI. This documentation contains 185 pages and 56 comments. 415 users have registered.
This page has been rendered in 0,01 seconds. Wiki revision 1.37.
|