|
Language Reference » Charting functions » drawBarChart
|
|
Latest updates
Toolbox
Google AdSense
|
drawBarChart - Draw a bar chart This function allows you to draw a bar chart. All the drawing parameters are given trough a $Format array. To learn more about this please read the Format array guide.
Calling this function
drawBarChart($Format="");Where : Format is an array containing the drawing parameters of the chart. Customisation array - Tune up your chart! It is possible to customize the bar chart rendering by playing with this array. Providing a detailled configuration is not mandatory. You can specify if the values must be written on the chart setting DisplayValues to TRUE or FALSE.
You can specify the text UP/RIGHT offset with DisplayOffset.
You can specify if you want that a shadow will be drawn under the labels setting DisplayShadow to TRUE.
You can specify the space between two series points with Interleave (expressed in percentage, 1 means one extra bar, 0 no gap).
You can specify the labels color with DisplayR,DisplayG,DisplayB.
You can specify if the area are wrapped around the 0 line setting AroundZero to TRUE.
You can draw area with rounded corners setting Rounded to TRUE.
You can specify an unique border color with BorderR,BorderG,BorderB,.
You can use the Surrounding option to define the border color. This value will be added to the R,G,B factors to define the border color.
You can draw the bars with a gradient overlay setting Gradient to TRUE.
You can change the way the gradient bars will be drawn setting GradientMode to GRADIENT_EFFECT_CAN.
You can specify the gradient starting color with GradientStartR,GradientStartG,GradientStartB.
You can specify the gradient ending color with GradientEndR,GradientEndG,GradientEndtB.
You can specify the gradient alpha with GradientAlpha.
You can override the 0 value by another static one with Floating0Value.
You can override the 0 value by using another data serie giving it‘s name through Floating0Serie.
You can highlight the 0-bottom of the bars setting Draw0Line to TRUE.
You can draw an inner overlay setting a factor to InnerSurrounding. This value will be added to the R,G,B bar values to define the inner border color.
You can specify statically the inner border color with InnerBorderR,InnerBorderG,InnerBorderB.
You can enable image map recording by setting RecordImageMap to TRUE. If you only have one data serie, you may want to override the palette to have each bar represented with a different color. To achieve this, just pass a palette formated array with OverrideColors. (see the last sample script) You can define if the labels color will be the same than the serie color of if you want to force it manually setting DisplayColor to : DISPLAY_MANUAL, color will be specified manually with DisplayR,DisplayG,DisplayB.
DISPLAY_AUTO, will use the serie color. You can specify if the labels will be displayed inside or outside the bars setting DisplayPos to : LABEL_POS_INSIDE, values will be written inside the bars (if possible).
LABEL_POS_OUTSIDE, values will be written outside the bars (default). The default gradient overlay (if you only set Gradient to TRUE) will be a white to black with 40% alpha. You can define the orientation of the labels setting DisplayOrientation to : ORIENTATION_AUTO, to let the library decide the best orientation.
ORIENTATION_HORIZONTAL, to force an horizontal orientation.
ORIENTATION_VERTICAL, to force a vertical orientation. Sample script 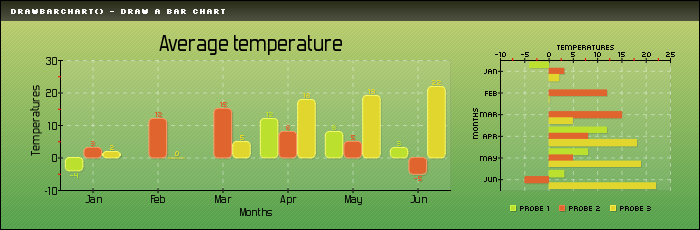
 /* pChart library inclusions */
 include("../class/pData.class.php");
 include("../class/pDraw.class.php");
 include("../class/pImage.class.php");

 /* Create and populate the pData object */
 $MyData = new pData();
 $MyData->addPoints(array(-4,VOID,VOID,12,8,3),"Probe 1");
 $MyData->addPoints(array(3,12,15,8,5,-5),"Probe 2");
 $MyData->addPoints(array(2,0,5,18,19,22),"Probe 3");
 $MyData->setSerieTicks("Probe 2",4);
 $MyData->setAxisName(0,"Temperatures");
 $MyData->addPoints(array("Jan","Feb","Mar","Apr","May","Jun"),"Labels");
 $MyData->setSerieDescription("Labels","Months");
 $MyData->setAbscissa("Labels");

 /* Create the pChart object */
 $myPicture = new pImage(700,230,$MyData);

 /* Draw the background */
 $Settings = array("R"=>170, "G"=>183, "B"=>87, "Dash"=>1, "DashR"=>190, "DashG"=>203, "DashB"=>107);
 $myPicture->drawFilledRectangle(0,0,700,230,$Settings);

 /* Overlay with a gradient */
 $Settings = array("StartR"=>219, "StartG"=>231, "StartB"=>139, "EndR"=>1, "EndG"=>138, "EndB"=>68, "Alpha"=>50);
 $myPicture->drawGradientArea(0,0,700,230,DIRECTION_VERTICAL,$Settings);
 $myPicture->drawGradientArea(0,0,700,20,DIRECTION_VERTICAL,array("StartR"=>0,"StartG"=>0,"StartB"=>0,"EndR"=>50,"EndG"=>50,"EndB"=>50,"Alpha"=>80));

 /* Add a border to the picture */
 $myPicture->drawRectangle(0,0,699,229,array("R"=>0,"G"=>0,"B"=>0));

 /* Write the picture title */
 $myPicture->setFontProperties(array("FontName"=>"../fonts/Silkscreen.ttf","FontSize"=>6));
 $myPicture->drawText(10,13,"drawBarChart() - draw a bar chart",array("R"=>255,"G"=>255,"B"=>255));

 /* Write the chart title */
 $myPicture->setFontProperties(array("FontName"=>"../fonts/Forgotte.ttf","FontSize"=>11));
 $myPicture->drawText(250,55,"Average temperature",array("FontSize"=>20,"Align"=>TEXT_ALIGN_BOTTOMMIDDLE));

 /* Draw the scale and the 1st chart */
 $myPicture->setGraphArea(60,60,450,190);
 $myPicture->drawFilledRectangle(60,60,450,190,array("R"=>255,"G"=>255,"B"=>255,"Surrounding"=>-200,"Alpha"=>10));
 $myPicture->drawScale(array("DrawSubTicks"=>TRUE));
 $myPicture->setShadow(TRUE,array("X"=>1,"Y"=>1,"R"=>0,"G"=>0,"B"=>0,"Alpha"=>10));
 $myPicture->setFontProperties(array("FontName"=>"../fonts/pf_arma_five.ttf","FontSize"=>6));
 $myPicture->drawBarChart(array("DisplayValues"=>TRUE,"DisplayColor"=>DISPLAY_AUTO,"Rounded"=>TRUE,"Surrounding"=>60));
 $myPicture->setShadow(FALSE);

 /* Draw the scale and the 2nd chart */
 $myPicture->setGraphArea(500,60,670,190);
 $myPicture->drawFilledRectangle(500,60,670,190,array("R"=>255,"G"=>255,"B"=>255,"Surrounding"=>-200,"Alpha"=>10));
 $myPicture->drawScale(array("Pos"=>SCALE_POS_TOPBOTTOM,"DrawSubTicks"=>TRUE));
 $myPicture->setShadow(TRUE,array("X"=>1,"Y"=>1,"R"=>0,"G"=>0,"B"=>0,"Alpha"=>10));
 $myPicture->drawBarChart();
 $myPicture->setShadow(FALSE);

 /* Write the chart legend */
 $myPicture->drawLegend(510,205,array("Style"=>LEGEND_NOBORDER,"Mode"=>LEGEND_HORIZONTAL));

 /* Render the picture (choose the best way) */
 $myPicture->autoOutput("pictures/example.drawBarChart.png");
Second Sample script 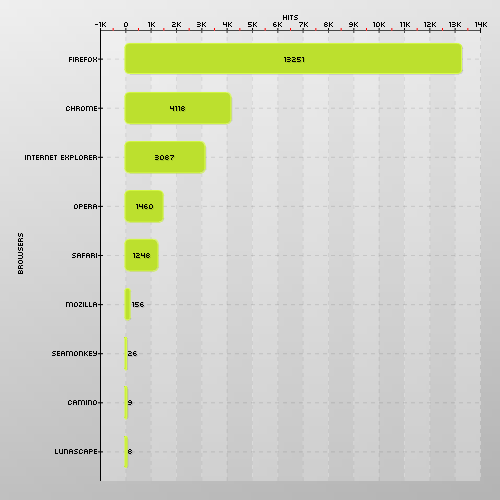
 /* pChart library inclusions */
 include("../class/pData.class.php");
 include("../class/pDraw.class.php");
 include("../class/pImage.class.php");

 /* Create and populate the pData object */
 $MyData = new pData();
 $MyData->addPoints(array(13251,4118,3087,1460,1248,156,26,9,8),"Hits");
 $MyData->setAxisName(0,"Hits");
 $MyData->addPoints(array("Firefox","Chrome","Internet Explorer","Opera","Safari","Mozilla","SeaMonkey","Camino","Lunascape"),"Browsers");
 $MyData->setSerieDescription("Browsers","Browsers");
 $MyData->setAbscissa("Browsers");

 /* Create the pChart object */
 $myPicture = new pImage(500,500,$MyData);
 $myPicture->drawGradientArea(0,0,500,500,DIRECTION_VERTICAL,array("StartR"=>240,"StartG"=>240,"StartB"=>240,"EndR"=>180,"EndG"=>180,"EndB"=>180,"Alpha"=>100));
 $myPicture->drawGradientArea(0,0,500,500,DIRECTION_HORIZONTAL,array("StartR"=>240,"StartG"=>240,"StartB"=>240,"EndR"=>180,"EndG"=>180,"EndB"=>180,"Alpha"=>20));
 $myPicture->setFontProperties(array("FontName"=>"../fonts/pf_arma_five.ttf","FontSize"=>6));

 /* Draw the chart scale */
 $myPicture->setGraphArea(100,30,480,480);
 $myPicture->drawScale(array("CycleBackground"=>TRUE,"DrawSubTicks"=>TRUE,"GridR"=>0,"GridG"=>0,"GridB"=>0,"GridAlpha"=>10, "Pos"=>SCALE_POS_TOPBOTTOM));

 /* Turn on shadow computing */
 $myPicture->setShadow(TRUE,array("X"=>1,"Y"=>1,"R"=>0,"G"=>0,"B"=>0,"Alpha"=>10));

 /* Draw the chart */
 $myPicture->drawBarChart(array("DisplayPos"=>LABEL_POS_INSIDE,"DisplayValues"=>TRUE,"Rounded"=>TRUE,"Surrounding"=>30));

 /* Write the legend */
 $myPicture->drawLegend(570,215,array("Style"=>LEGEND_NOBORDER,"Mode"=>LEGEND_HORIZONTAL));

 /* Render the picture (choose the best way) */
 $myPicture->autoOutput("pictures/example.drawBarChart.vertical.png");
Third Sample script 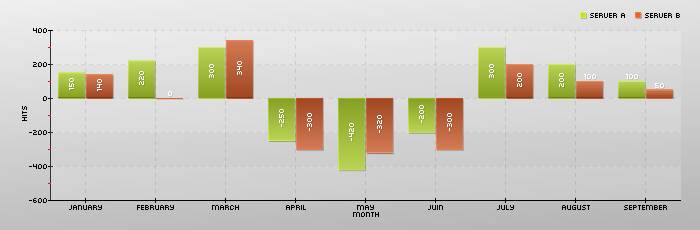
 include("class/pData.class.php");
 include("class/pDraw.class.php");
 include("class/pImage.class.php");

 $MyData = new pData();
 $MyData->addPoints(array(150,220,300,-250,-420,-200,300,200,100),"Server A");
 $MyData->addPoints(array(140,240,340,-300,-320,-300,200,100,50),"Server B");
 $MyData->setAxisName(0,"Hits");

 $MyData->addPoints(array("January","February","March","April","May","Juin","July","August","September"),"Months");
 $MyData->setSerieDescription("Months","Month");
 $MyData->setAbscissa("Months");

 $myPicture = new pImage(800,300,$MyData);

 $myPicture->drawGradientArea(0,0,800,300,DIRECTION_VERTICAL,array("StartR"=>240,"StartG"=>240,"StartB"=>240,"EndR"=>180,"EndG"=>180,"EndB"=>180,"Alpha"=>100));
 $myPicture->drawGradientArea(0,0,800,300,DIRECTION_HORIZONTAL,array("StartR"=>240,"StartG"=>240,"StartB"=>240,"EndR"=>180,"EndG"=>180,"EndB"=>180,"Alpha"=>20));

 $myPicture->setFontProperties(array("FontName"=>"fonts/pf_arma_five.ttf","FontSize"=>6));

 $myPicture->setGraphArea(50,30,780,270);
 $myPicture->drawScale(array("CycleBackground"=>TRUE,"DrawSubTicks"=>TRUE,"GridR"=>0,"GridG"=>0,"GridB"=>0,"GridAlpha"=>10));

 $myPicture->setShadow(TRUE,array("X"=>1,"Y"=>1,"R"=>0,"G"=>0,"B"=>0,"Alpha"=>10));

 $settings = array("Gradient"=>TRUE, "DisplayPos"=>LABEL_POS_INSIDE, "DisplayValues"=>TRUE, "DisplayR"=>255, "DisplayG"=>255, "DisplayB"=>255, "DisplayShadow"=>TRUE, "Surrounding"=>30);
 $myPicture->drawBarChart($settings);

 $myPicture->drawLegend(650,12,array("Style"=>LEGEND_NOBORDER,"Mode"=>LEGEND_HORIZONTAL));

 $myPicture->Render("drawbarchart3.png");
Customized palette sample script 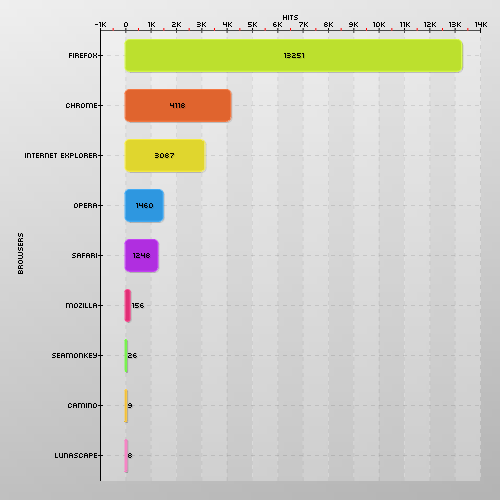
 /* pChart library inclusions */
 include("../class/pData.class.php");
 include("../class/pDraw.class.php");
 include("../class/pImage.class.php");

 /* Create and populate the pData object */
 $MyData = new pData();
 $MyData->addPoints(array(13251,4118,3087,1460,1248,156,26,9,8),"Hits");
 $MyData->setAxisName(0,"Hits");
 $MyData->addPoints(array("Firefox","Chrome","Internet Explorer","Opera","Safari","Mozilla","SeaMonkey","Camino","Lunascape"),"Browsers");
 $MyData->setSerieDescription("Browsers","Browsers");
 $MyData->setAbscissa("Browsers");

 /* Create the pChart object */
 $myPicture = new pImage(500,500,$MyData);
 $myPicture->drawGradientArea(0,0,500,500,DIRECTION_VERTICAL,array("StartR"=>240,"StartG"=>240,"StartB"=>240,"EndR"=>180,"EndG"=>180,"EndB"=>180,"Alpha"=>100));
 $myPicture->drawGradientArea(0,0,500,500,DIRECTION_HORIZONTAL,array("StartR"=>240,"StartG"=>240,"StartB"=>240,"EndR"=>180,"EndG"=>180,"EndB"=>180,"Alpha"=>20));
 $myPicture->setFontProperties(array("FontName"=>"../fonts/pf_arma_five.ttf","FontSize"=>6));

 /* Draw the chart scale */
 $myPicture->setGraphArea(100,30,480,480);
 $myPicture->drawScale(array("CycleBackground"=>TRUE,"DrawSubTicks"=>TRUE,"GridR"=>0,"GridG"=>0,"GridB"=>0,"GridAlpha"=>10, "Pos"=>SCALE_POS_TOPBOTTOM));

 /* Turn on shadow computing */
 $myPicture->setShadow(TRUE,array("X"=>1,"Y"=>1,"R"=>0,"G"=>0,"B"=>0,"Alpha"=>10));

 /* Create the per bar palette */
 $Palette = array("0"=>array("R"=>188,"G"=>224,"B"=>46,"Alpha"=>100),
                  "1"=>array("R"=>224,"G"=>100,"B"=>46,"Alpha"=>100),
                  "2"=>array("R"=>224,"G"=>214,"B"=>46,"Alpha"=>100),
                  "3"=>array("R"=>46,"G"=>151,"B"=>224,"Alpha"=>100),
                  "4"=>array("R"=>176,"G"=>46,"B"=>224,"Alpha"=>100),
                  "5"=>array("R"=>224,"G"=>46,"B"=>117,"Alpha"=>100),
                  "6"=>array("R"=>92,"G"=>224,"B"=>46,"Alpha"=>100),
                  "7"=>array("R"=>224,"G"=>176,"B"=>46,"Alpha"=>100));

 /* Draw the chart */
 $myPicture->drawBarChart(array("DisplayPos"=>LABEL_POS_INSIDE,"DisplayValues"=>TRUE,"Rounded"=>TRUE,"Surrounding"=>30,"OverrideColors"=>$Palette));

 /* Write the legend */
 $myPicture->drawLegend(570,215,array("Style"=>LEGEND_NOBORDER,"Mode"=>LEGEND_HORIZONTAL));

 /* Render the picture (choose the best way) */
 $myPicture->autoOutput("pictures/example.drawBarChart.palette.png");
Floating 0 sample script 
 /* pChart library inclusions */
 include("../class/pData.class.php");
 include("../class/pDraw.class.php");
 include("../class/pImage.class.php");

 /* Create and populate the pData object */
 $MyData = new pData();
 $MyData->addPoints(array(150,220,300,250,420,200,300,200,100),"Server A");
 $MyData->addPoints(array(140,0,340,300,320,300,200,100,50),"Server B");
 $MyData->setAxisName(0,"Hits");
 $MyData->addPoints(array("January","February","March","April","May","Juin","July","August","September"),"Months");
 $MyData->setSerieDescription("Months","Month");
 $MyData->setAbscissa("Months");

 /* Create the floating 0 data serie */
 $MyData->addPoints(array(60,80,20,40,0,50,90,30,100),"Floating 0");
 $MyData->setSerieDrawable("Floating 0",FALSE);

 /* Create the pChart object */
 $myPicture = new pImage(700,230,$MyData);
 $myPicture->drawGradientArea(0,0,700,230,DIRECTION_VERTICAL,array("StartR"=>240,"StartG"=>240,"StartB"=>240,"EndR"=>180,"EndG"=>180,"EndB"=>180,"Alpha"=>100));
 $myPicture->drawGradientArea(0,0,700,230,DIRECTION_HORIZONTAL,array("StartR"=>240,"StartG"=>240,"StartB"=>240,"EndR"=>180,"EndG"=>180,"EndB"=>180,"Alpha"=>20));
 $myPicture->setFontProperties(array("FontName"=>"../fonts/pf_arma_five.ttf","FontSize"=>6));

 /* Draw the scale  */
 $myPicture->setGraphArea(50,30,680,200);
 $myPicture->drawScale(array("CycleBackground"=>TRUE,"DrawSubTicks"=>TRUE,"GridR"=>0,"GridG"=>0,"GridB"=>0,"GridAlpha"=>10));

 /* Turn on shadow computing */
 $myPicture->setShadow(TRUE,array("X"=>1,"Y"=>1,"R"=>0,"G"=>0,"B"=>0,"Alpha"=>10));

 /* Draw the chart */
 $settings = array("Floating0Serie"=>"Floating 0","Draw0Line"=>TRUE,"Gradient"=>TRUE, "DisplayPos"=>LABEL_POS_INSIDE,"DisplayValues"=>TRUE,"DisplayR"=>255, "DisplayG"=>255,"DisplayB"=>255,"DisplayShadow"=>TRUE,"Surrounding"=>10);
 $myPicture->drawBarChart($settings);

 /* Write the chart legend */
 $myPicture->drawLegend(580,12,array("Style"=>LEGEND_NOBORDER,"Mode"=>LEGEND_HORIZONTAL));

 /* Render the picture (choose the best way) */
 $myPicture->autoOutput("pictures/example.drawBarChart.floating.png");
Inner border sample script 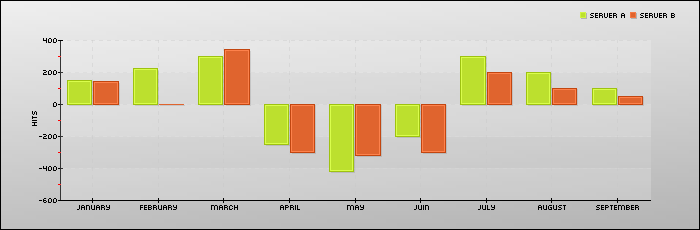
 /* pChart library inclusions */
 include("../class/pData.class.php");
 include("../class/pDraw.class.php");
 include("../class/pImage.class.php");

 /* Create and populate the pData object */
 $MyData = new pData();
 $MyData->addPoints(array(150,220,300,-250,-420,-200,300,200,100),"Server A");
 $MyData->addPoints(array(140,0,340,-300,-320,-300,200,100,50),"Server B");
 $MyData->setAxisName(0,"Hits");
 $MyData->addPoints(array("January","February","March","April","May","Juin","July","August","September"),"Months");
 $MyData->setSerieDescription("Months","Month");
 $MyData->setAbscissa("Months");

 /* Create the pChart object */
 $myPicture = new pImage(700,230,$MyData);

 /* Turn of Antialiasing */
 $myPicture->Antialias = FALSE;

 /* Add a border to the picture */
 $myPicture->drawGradientArea(0,0,700,230,DIRECTION_VERTICAL,array("StartR"=>240,"StartG"=>240,"StartB"=>240,"EndR"=>180,"EndG"=>180,"EndB"=>180,"Alpha"=>100));
 $myPicture->drawGradientArea(0,0,700,230,DIRECTION_HORIZONTAL,array("StartR"=>240,"StartG"=>240,"StartB"=>240,"EndR"=>180,"EndG"=>180,"EndB"=>180,"Alpha"=>20));
 $myPicture->drawRectangle(0,0,699,229,array("R"=>0,"G"=>0,"B"=>0));

 /* Set the default font */
 $myPicture->setFontProperties(array("FontName"=>"../fonts/pf_arma_five.ttf","FontSize"=>6));

 /* Define the chart area */
 $myPicture->setGraphArea(60,40,650,200);

 /* Draw the scale */
 $scaleSettings = array("GridR"=>200,"GridG"=>200,"GridB"=>200,"DrawSubTicks"=>TRUE,"CycleBackground"=>TRUE);
 $myPicture->drawScale($scaleSettings);

 /* Write the chart legend */
 $myPicture->drawLegend(580,12,array("Style"=>LEGEND_NOBORDER,"Mode"=>LEGEND_HORIZONTAL));

 /* Turn on shadow computing */
 $myPicture->setShadow(TRUE,array("X"=>1,"Y"=>1,"R"=>0,"G"=>0,"B"=>0,"Alpha"=>10));

 /* Draw the chart */
 $myPicture->setShadow(TRUE,array("X"=>1,"Y"=>1,"R"=>0,"G"=>0,"B"=>0,"Alpha"=>10));
 $settings = array("Surrounding"=>-30,"InnerSurrounding"=>30);
 $myPicture->drawBarChart($settings);

 /* Render the picture (choose the best way) */
 $myPicture->autoOutput("pictures/example.drawBarChart.simple.png");
© Copyrights
Components used on this web site : Famfamfam icons has been made by Mark James, Rounded corners lite has been coded by Cameron Cooke and Tim Hutchison, SyntaxHighlighter has
been written by Alex Gorbatchev. pChart and this web site have been created by Jean-Damien POGOLOTTI. This documentation contains 185 pages and 56 comments. 415 users have registered.
This page has been rendered in 0,03 seconds. Wiki revision 1.37.
|