 |
Color part of the graph using hidden threshold line
| Author |
Message |
|
ahchu
pChart user
Joined: Thu Jan 13, 2011 9:20 pm
Posts: 6
|
 Color part of the graph using hidden threshold line Hi, Is there an easy way to draw the graph that has specific area colored? For ex: you set a threshold line -> if the graph has curves above threshold then it will have its area or line's color different than the curves under threshold line. Like the one show below 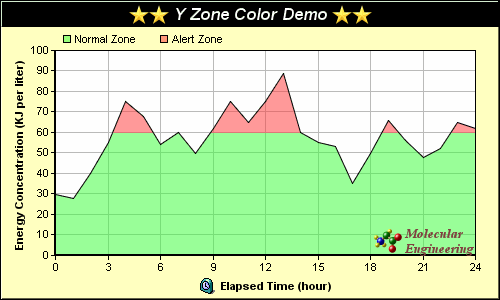 It should be a work around for this by dividing the whole graph to smaller graphs which are graphs under threshold and graphs above threshold. Then for each graph, it will be filled with different color. The problem is the areas are filled based on X-zone (vertically), not Y-zone (Horizontally) like the graph above... Thank you, Anh
|
| Thu Jan 13, 2011 9:33 pm |

|
|
|
jean-damien
Site Admin
Joined: Thu Dec 02, 2010 2:31 pm
Posts: 409
Location: France
|
Re: Color part of the graph using hidden threshold line Hi,
Conditional chart formatting is in project, I cannot give you a date but this is something that I have in my todo already.
I'll keep you posted.
Kind regards,
JD.
|
| Thu Jan 13, 2011 9:43 pm |

|
|
|
ahchu
pChart user
Joined: Thu Jan 13, 2011 9:20 pm
Posts: 6
|
Re: Color part of the graph using hidden threshold line Hi JD,
I created a "vertical colored area" here is the code. The code will "break" the main graph to two types of graph: >Threshold, <Threshold line. I just am just too lazy to add the colored code. But as you can see, the area color change when it meet Threshold line.
|
| Sat Jan 15, 2011 6:23 am |
|
|
|
jean-damien
Site Admin
Joined: Thu Dec 02, 2010 2:31 pm
Posts: 409
Location: France
|
Re: Color part of the graph using hidden threshold line Interesting rendering! I got some kind of similiar idea some days ago, using the derivative value of the charting function to determine the chart velocity and apply a specific color to the segments. JD.
|
| Sat Jan 15, 2011 8:42 pm |
|
|
|
ahchu
pChart user
Joined: Thu Jan 13, 2011 9:20 pm
Posts: 6
|
Re: Color part of the graph using hidden threshold line Here is the "horizontal area colored" graph. This one is faster since there are only 2 graphs, "Below" and "Above" Threshold. It does not break the graph into many other graphs, only 2.
|
| Sat Jan 15, 2011 9:28 pm |
|
|
|
ahchu
pChart user
Joined: Thu Jan 13, 2011 9:20 pm
Posts: 6
|
Re: Color part of the graph using hidden threshold line jean-damien wrote: Interesting rendering! I got some kind of similiar idea some days ago, using the derivative value of the charting function to determine the chart velocity and apply a specific color to the segments. JD. Yes definitely, derivative is used to find slope(goes down or up), min, max, rate of change. Mine is a little different. The hardest part of this is giving you just few points (in this case 40 points) you have to make the change occur right at the threshold line. Question is how can you do that with rough data: EX: y[20]=30, y[21]=45,etc, threshold=38, the graph change will be at point y[20]=30 not at threshold=38 -> Solve the problem by increase the resolution of the graph by breaking the main curve into say 1000 points <-> x increases 0.01 (for time=10s ->dx=10/1000=0.01). How to do that? A: By using linear interpolation and binary search -> Problem solved!
|
| Sun Jan 16, 2011 1:26 am |
|
|
|
ahchu
pChart user
Joined: Thu Jan 13, 2011 9:20 pm
Posts: 6
|
Re: Color part of the graph using hidden threshold line How can I set gradient for series color? I dont see it on SetPalette function.
Thanks,
|
| Sun Jan 16, 2011 7:13 am |
|
|
|
jean-damien
Site Admin
Joined: Thu Dec 02, 2010 2:31 pm
Posts: 409
Location: France
|
Re: Color part of the graph using hidden threshold line I really appreciate your work on this!
Idea is on its way, I can't promise something relevant in the 2.0.13 but probably for the 2.0.14.
Gradients are not supported yet for area charts (mainly because this would need to rewrite the GD drawpolygon() function that is a true nightmare). Only few function can handle it (drawBarChart(),drawStackedBarChart())
JD.
|
| Sun Jan 16, 2011 1:05 pm |
|
|
|
jean-damien
Site Admin
Joined: Thu Dec 02, 2010 2:31 pm
Posts: 409
Location: France
|
Re: Color part of the graph using hidden threshold line I've made a draft implementation of the series slope computing here : drawDerivative(). It may be useful to track values changes, we'll see if it have some interest. JD.
Attachments:
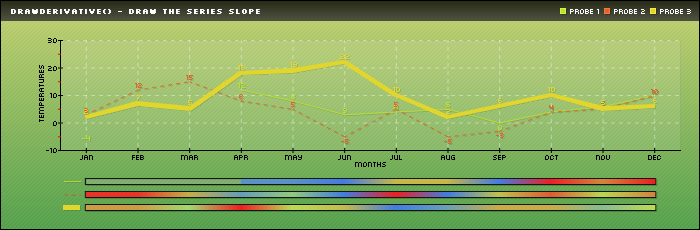 drawDerivative.png [ 29.5 KiB | Viewed 15717 times ]
|
| Mon Jan 17, 2011 5:05 pm |
|
|
|
ahchu
pChart user
Joined: Thu Jan 13, 2011 9:20 pm
Posts: 6
|
Re: Color part of the graph using hidden threshold line jean-damien wrote: I've made a draft implementation of the series slope computing here : drawDerivative(). It may be useful to track values changes, we'll see if it have some interest. JD. Hi JD, Very nice!!! Personally I very like this idea, it can tell how steep the slope is. However, if the gradient color can be applied directly to the graph, I am sure it will draw more attention. I would love helping you to bring the gradient color into the graph, but I truly say that I dont have much knowledge about GDI and computer graphic stuff,... I will take a look, can you tell me where should I start? With this idea, I think you can bring the " black body radiation" chart into the library  . This chart is used a lot in research and education area.
|
| Mon Jan 17, 2011 5:34 pm |
|
|
Who is online |
Users browsing this forum: No registered users and 3 guests |
|
You cannot post new topics in this forum
You cannot reply to topics in this forum
You cannot edit your posts in this forum
You cannot delete your posts in this forum
You cannot post attachments in this forum
|

|
|
