 |
How to format the Y-axis tick values?
| Author |
Message |
|
psyclo
pChart user
Joined: Wed Jan 05, 2011 4:22 pm
Posts: 4
|
 How to format the Y-axis tick values? I'm very new to pChart and am extremely impressed so far, but I'm having a little trouble getting started. It would be nice to have an exhaustive option list for the drawScale() method, that would detail the options and the expected values for each.
Anyway, my issue right now is with the Y-axis. I have data points in the millions, and have left it to automatic, so I might have a bar chart with the Y-axis from 29M to 33M. Unfortunately, that is all it displays, so for multiple ticks, it will have 30M, 30M, 30M, etc. I would like to be able to configure this tick to read "30.0M", "31.4M" or something similar.
Furthermore, the label in the chart, on each bar, reads like this, "31311325". I would like to format it with commas, "31,311,325". However, when I use number_format() on the AddPoints() function, it causes the scale on the Y-axis to lose the "M" on each label, so instead of "31M", I have just "31".
Again, thanks for a tremendous tool. I look forward to working with it.
|
| Wed Jan 05, 2011 4:37 pm |

|
|
|
jean-damien
Site Admin
Joined: Thu Dec 02, 2010 2:31 pm
Posts: 409
Location: France
|
Re: How to format the Y-axis tick values? Hi Psyclo, Indeed, I've left an old test statement in the pDraw class that force the scale to use a metric format when the max-min value is more than 2k. To disable it, remove this two lines from the pDraw.class file : Code: if ( ( $Parameters["ScaleMax"] - $Parameters["ScaleMin"] > 2000 ) )
$Parameters["Display"] = AXIS_FORMAT_METRIC;
To know how to use the different axis formats you can check this page : http://wiki.pchart.net/doc.dataset.setaxisdisplay.htmlI'll add some more functionalities to specify the rounding method and maybe an automated mode that will determine it automatically. Kind regards, JD.
|
| Wed Jan 05, 2011 5:20 pm |

|
|
|
psyclo
pChart user
Joined: Wed Jan 05, 2011 4:22 pm
Posts: 4
|
Re: How to format the Y-axis tick values? Thanks for the prompt response, JD.
Commenting out the lines doesn't put the "K" or "M" on the number if I use "number_format()" to put commas on the data values. It sees the number as a string, so doesn't even try to do the metric format.
Is there a way I'm missing to format the data point values? I need to load the data as integers so the metric format works (understanding that having more control over the precision would be great!), but then I need to display the number with commas in the chart itself.
I'm really having fun with your tool, and appreciate what you have done here.
Thanks!
|
| Thu Jan 06, 2011 3:05 pm |
|
|
|
jean-damien
Site Admin
Joined: Thu Dec 02, 2010 2:31 pm
Posts: 409
Location: France
|
Re: How to format the Y-axis tick values? Currently the points on the chart are formatted with the same configuration than the Axis where the data serie is bound.
Maybe we can add more control here, this shouldn't be too complicated to implement.
I've modified the scaling algorithm so it will not display anymore many time the same value but will try to find at which precision the labels are drawn.
This change will be published with the 2.0.11 subversion
JD.
Attachments:
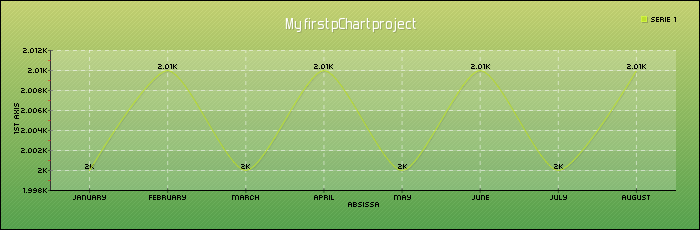 untitled.png [ 26.37 KiB | Viewed 17290 times ]
|
| Thu Jan 06, 2011 3:17 pm |
|
|
|
psyclo
pChart user
Joined: Wed Jan 05, 2011 4:22 pm
Posts: 4
|
Re: How to format the Y-axis tick values?  Very impressive! Thanks so much, for the quick response and the fix. This is fantastic!
|
| Thu Jan 06, 2011 3:42 pm |
|
|
|
jean-damien
Site Admin
Joined: Thu Dec 02, 2010 2:31 pm
Posts: 409
Location: France
|
Re: How to format the Y-axis tick values? I've posted the new 2.0.11 subversion on the pChart web site correcting this bug. You can get it here : http://www.pchart.net/download
|
| Fri Jan 07, 2011 3:56 pm |
|
|
|
wranger
pChart user
Joined: Fri Jan 07, 2011 8:08 pm
Posts: 7
|
Re: How to format the Y-axis tick values? Hi guys,
I have some problems with values > 1 on the Y-Axis. Is it possible to round the values logical?
The first value should be 0, or?
Regards
Attachments:
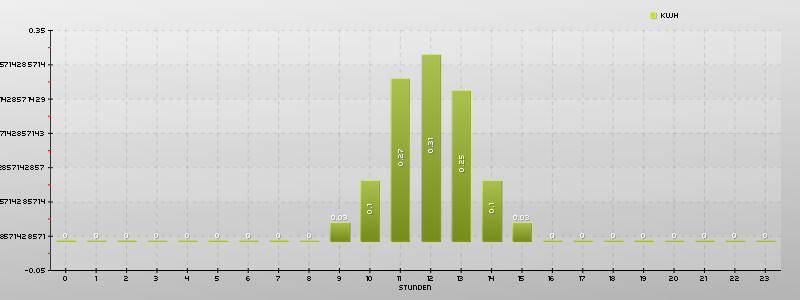 stundenwerte.png [ 21.08 KiB | Viewed 17260 times ]
|
| Mon Jan 10, 2011 2:27 pm |
|
|
|
jean-damien
Site Admin
Joined: Thu Dec 02, 2010 2:31 pm
Posts: 409
Location: France
|
Re: How to format the Y-axis tick values? Can you please try to set the $Factors parameter of the drawScale() function to array(1,2) ? Code: $myPicture->drawScale(array("Factor"=>array(1,2));
JD.
|
| Mon Jan 10, 2011 2:35 pm |
|
|
|
wranger
pChart user
Joined: Fri Jan 07, 2011 8:08 pm
Posts: 7
|
Re: How to format the Y-axis tick values? Hmm, no changes. Code: $myPicture->drawScale(array("Factor"=>array(1,2), "CycleBackground"=>TRUE,"DrawSubTicks"=>TRUE,"GridR"=>0,"GridG"=>0,"GridB"=>0,"GridAlpha"=>10));
|
| Mon Jan 10, 2011 3:04 pm |
|
|
|
jean-damien
Site Admin
Joined: Thu Dec 02, 2010 2:31 pm
Posts: 409
Location: France
|
Re: How to format the Y-axis tick values? Sorry, missed the "s" at the end of the Factor options ;o) You should have : Code: $myPicture->drawScale(array("Factors"=>array(1,2), "CycleBackground"=>TRUE,"DrawSubTicks"=>TRUE,"GridR"=>0,"GridG"=>0,"GridB"=>0,"GridAlpha"=>10));
|
| Mon Jan 10, 2011 3:12 pm |
|
|
Who is online |
Users browsing this forum: No registered users and 9 guests |
|
You cannot post new topics in this forum
You cannot reply to topics in this forum
You cannot edit your posts in this forum
You cannot delete your posts in this forum
You cannot post attachments in this forum
|

|
|
